Issue #79, Volume #3

America’s Four Options For Avoiding Collapse
Inside today's Daily Journal…
|
Editor’s note: Although Erez Kalir ordinarily focuses on technology, blockchain, and biotech issues in Porter & Co.’s Tech Frontiers, Porter turned the Journal over to him today so Erez could tell the story of America’s slow descent into what he calls “the Endgame”... when the U.S. can no longer scale the mountains of debt it has accumulated. He lays out four potential ways out…
In 1944, as World War II raged across Europe and the Pacific, delegates from 44 Allied nations gathered at the Mount Washington Hotel in Bretton Woods, New Hampshire, to design the postwar financial order. The United States emerged from those negotiations financially on top of the world. Our industrial base was intact. Our gold reserves were unmatched. Our economy represented nearly half of global GDP.
The arrangement forged at Bretton Woods was elegant in its simplicity: the dollar would become the world’s reserve currency, convertible into gold at $35 per ounce. Other currencies would anchor themselves to the dollar. And because the dollar sat at the center of global trade, the United States gained something extraordinary: the ability to finance itself more cheaply than any empire in history.
For decades, that “exorbitant privilege,” as the French foreign minister described the U.S. position, seemed inexhaustible.
Then came 1971, when President Richard Nixon closed the “gold window” and severed the dollar’s final tether to gold. America’s debt began its long upward spiral… first slowly… then rapidly… then exponentially.
Today, America’s fiscal situation is well within the zone from which there is no painless exit. Indeed, the U.S. is almost certainly already in the chapter that may ultimately be remembered as the Endgame.
Let me explain…
The United States federal debt now stands at roughly $40 trillion – more than 120% of GDP. Historically, America has reached debt levels this extreme only once before: during World War II, when debt briefly surged above 119% of GDP in 1946 as the nation financed a global war for survival.
But there’s a crucial difference between then and now.
In 1946, we possessed the youngest industrial workforce in the world, a manufacturing base untouched by war, and a demographic boom just beginning. Debt was high, but the country’s growth trajectory was even higher. We could effectively grow our way out of the problem – and we did.
Today, the opposite is true.
The U.S. faces aging demographics, rising entitlement costs, persistent fiscal deficits, and an economy increasingly dependent on debt-financed consumption. More ominously, the debt itself has become self-reinforcing: the government must now borrow staggering sums simply to pay interest on prior borrowing.
Stan Druckenmiller, the greatest macro investor of his generation, indeed perhaps of all time, has warned repeatedly that America’s fiscal trajectory is unsustainable. And the numbers explain why. Interest expense on the federal debt has now become one of the largest items in the federal budget, surpassing defense spending and rapidly converging with Medicare and Medicaid combined.
Pause for a moment to appreciate the absurdity of that sentence.
The United States government is increasingly borrowing money to pay interest on money it already borrowed.
That is not a stable equilibrium – it’s a debt spiral.
And once countries enter debt spirals of this magnitude, there are only four ways out.
The first is austerity: Slash spending, raise taxes, and restore fiscal discipline. Politicians occasionally pretend this remains possible. It is not. No modern American administration, Republican or Democrat, has demonstrated the slightest willingness to impose the level of austerity necessary to stabilize a $40 trillion debt load. The math is simply too brutal. Meaningful austerity would require politically toxic cuts to Social Security, Medicare, defense spending, or all three simultaneously. It would likely trigger a severe recession and possibly a depression. Democracies rarely choose this path voluntarily. America certainly will not.
The second possibility is outright default: This, too, won’t happen. The United States borrows in its own currency. Unlike Argentina, Greece, or Zimbabwe, America does not owe debt in a foreign currency it cannot print. Treasury default would detonate the global financial system and destroy the dollar’s reserve currency status overnight. Washington will choose virtually any alternative before permitting that outcome.
The third path is growth: In theory, sufficiently rapid economic growth could outpace the debt burden. This is what happened after World War II. But once again, the arithmetic is merciless. Nominal GDP growth would need to remain sustainably above the government’s borrowing costs for many years while deficits simultaneously narrowed. In an aging, indebted society growing at roughly 2% real GDP annually, that outcome borders on fantasy.
Which leaves only the fourth and last option – one we already know well: Money printing.
Not explicitly, perhaps. Not in language central bankers will use publicly. But effectively and functionally, the Endgame leads to the same place: the monetization of government debt.
Many investors believe this process must inevitably culminate in a collapse of the Treasury market itself – a violent upward spiral in long-dated Treasury yields as buyers refuse to finance America’s deficits.
I don’t believe that will happen.
Why?
Because the Federal Reserve will never allow it to happen.
Instead, when the pressure becomes sufficiently acute, the Fed will almost certainly impose some form of yield-curve control.
Yield-curve control (“YCC”) sounds exotic, but the concept is straightforward. The central bank sets a ceiling on Treasury yields and enforces it by printing money to purchase bonds whenever necessary.
Imagine the Fed effectively standing up and announcing:
Any sellers of 10-year or 30-year Treasuries? We’re your bid. We will buy as much as necessary to keep yields below this level.
That is yield curve control.
And despite sounding radical, it’s not theoretical. The Federal Reserve itself implemented YCC after World War II, pegging long-term Treasury yields to help the U.S. manage its enormous wartime debt burden. More recently, the Bank of Japan deployed YCC for years to suppress Japanese government bond yields amid Japan’s own debt super-cycle.
Ben Bernanke, the former Fed Chair and perhaps the world’s foremost scholar of monetary crises, wrote extensively about such policies and their historical precedents. The new Fed Chair, Kevin Warsh, emerged intellectually from the Bernanke era and is deeply familiar with both the theory and historical YCC implementation.
Investors should not underestimate how quickly the policy consensus can shift once debt servicing costs become politically intolerable.
But there’s a catch: The Fed can control Treasury yields, even at the long end of the yield curve. It cannot simultaneously preserve the purchasing power of the dollar. That’s the price of the Endgame.
When the Fed intervenes to limit yields, it does so by creating new dollars to absorb Treasury supply. The bond market remains orderly because the central bank becomes the buyer of last resort. Treasury yields stay artificially suppressed. But the currency absorbs the pressure instead. In effect, the government escapes default not by refusing to pay its debts, but by repaying them in increasingly diluted dollars.
This is why sophisticated investors increasingly understand that the real risk is not Treasury default. The real risk is dollar debasement.
So how should investors prepare?
Three essential hedges:
1. Gold and precious metals. Gold has survived every monetary regime in human history because it cannot be printed by politicians or central bankers. When confidence in fiat currencies erodes, gold tends to reassert its monetary role with astonishing speed.
2. Bitcoin and Ethereum, or what I’ve described in Tech Frontiers as the “blockchain blue chips.” Many traditional investors still dismiss digital assets as speculative toys. Those investors are misunderstanding the deeper story. Bitcoin, specifically, is increasingly behaving like a digitally native form of monetary scarcity – “gold for the internet age.” In a world of accelerating fiat debasement, scarce digital assets may become profoundly important stores of value.
3. Real assets: productive real estate, infrastructure, energy assets, and hard commodities. In inflationary monetary regimes, tangible assets tend to preserve purchasing power far better than financial claims denominated in paper currency.
None of this means the Endgame arrives tomorrow. Empires and monetary systems rarely collapse suddenly. As an Ernest Hemingway character famously observed in his novel The Sun Also Rises, a man goes broke, “gradually, then suddenly.”
But the direction of travel is becoming increasingly difficult to mistake.
The Endgame is coming, eventually.
Will you be ready?
Tell us what you think of today’s Daily Journal: porterstansberrydirect@gmail.com.
Erez Kalir
Berkeley, California
Porter invited Erez, Distressed Investing editor Marty Fridson, and other Porter & Co. analysts to join him for an urgent summit called The Final Melt-Up where they explored all of this in much greater detail – and all the analysts join forces to lay out a step-by-step plan for navigating today’s treacherous market.
This all-hands broadcast was released last week, and if you haven’t watched it yet, please go here now because this may be one of the most important events Porter has ever organized.
Together, the entire team joins Porter to lay out exactly how to both safeguard your wealth and grow it during this Final Melt-Up.

3 Things To Know Before We Go…
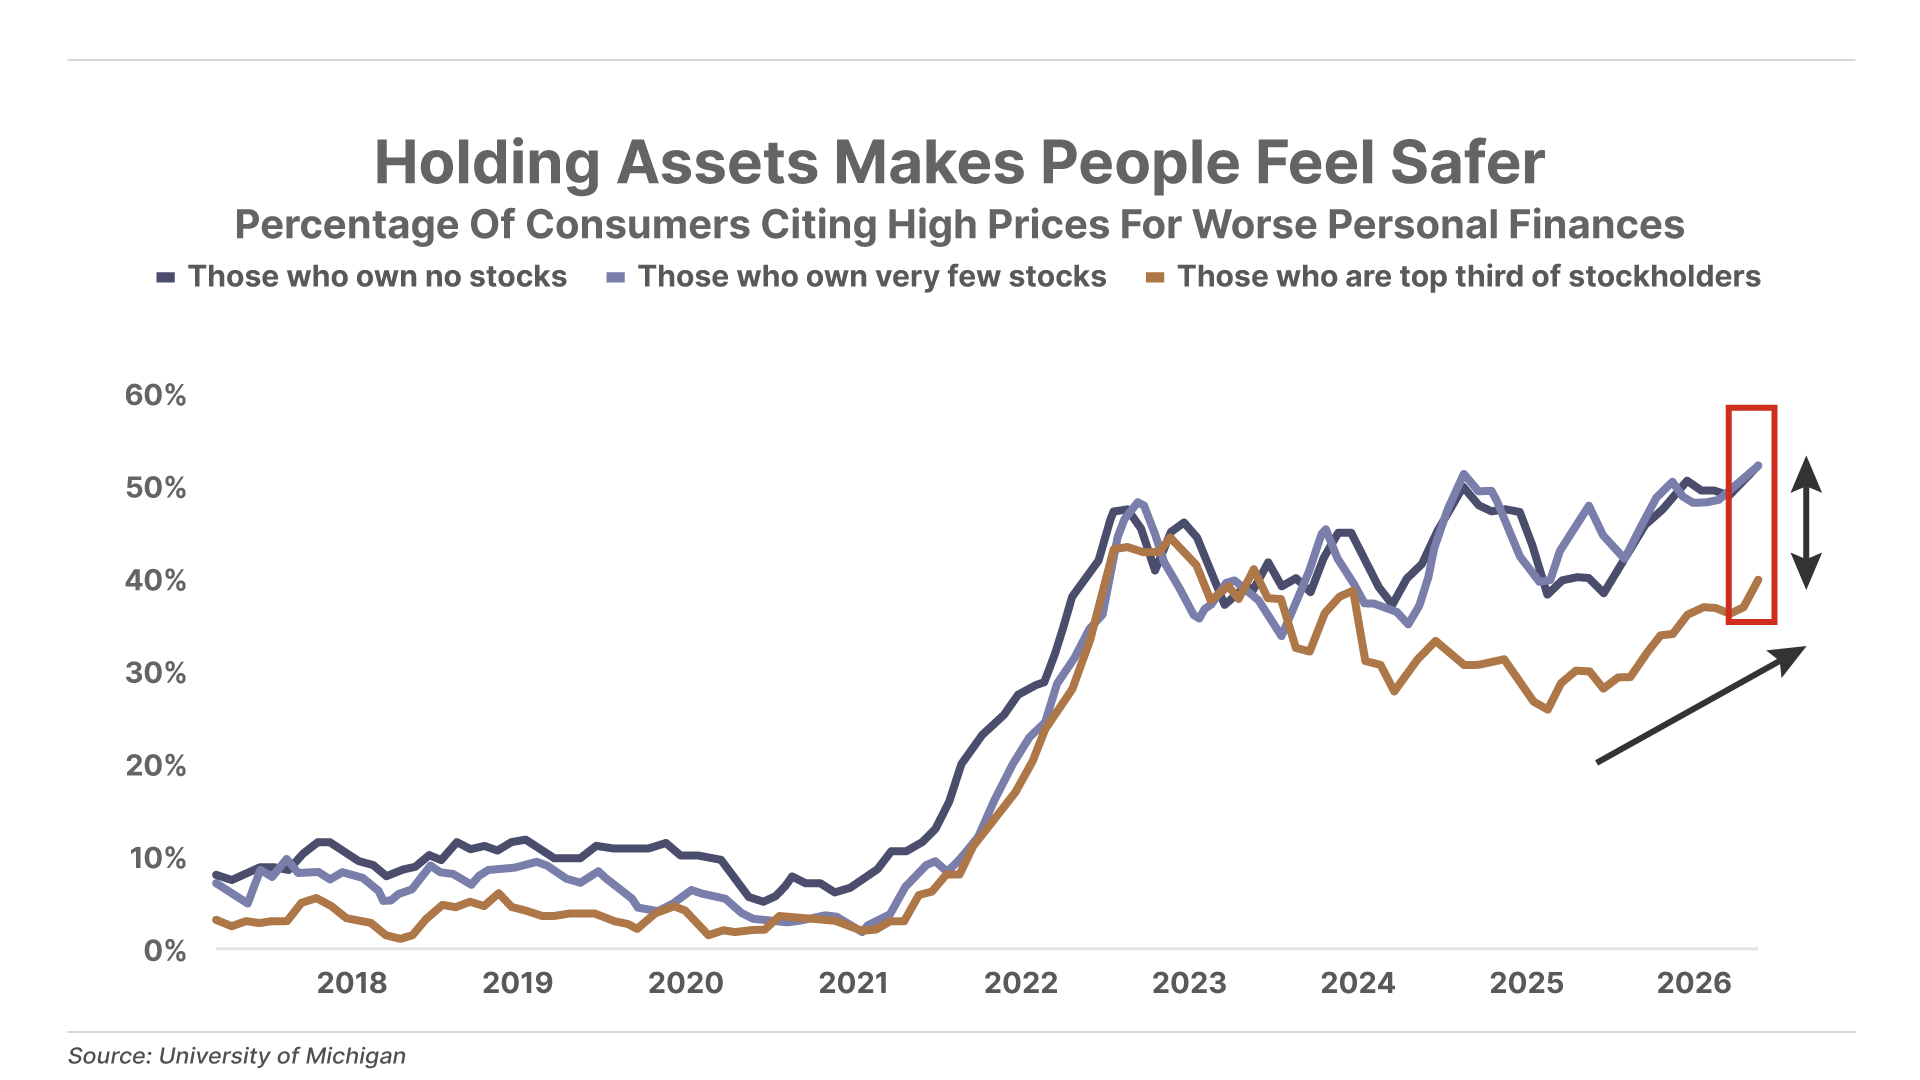
1. Assets shield investors from inflation. Roughly 55% of consumers with no stock holdings cited high prices as the reason for worsening personal finances – but only 40% of those with significant stock holdings flagged high prices as a concern. The resulting 15-percentage-point gap is the second widest divergence in over 10 years. This is the Cantillon Effect in real time – and the political response to widening divergence is itself bullish for hard assets.
2. Mining margins lead other sectors. A surge in commodity prices – with gold above $4,500 per ounce against costs of only $1,600 – has turned the industry into a rare profit machine. The median margin for the top 20 precious- and base-metals miners has climbed to 31%, nearly double the 17% median for S&P 500 tech companies and the highest of any sector in the global economy.
3. China’s selling spree in Treasuries. China’s U.S. Treasury holdings have dropped to $650 billion, the lowest levels since 2008. This continues a decade-long liquidation, which began in 2016 when China held $1.3 trillion in Treasuries. The accelerated selling coincided with the start of a record-setting bear market in U.S. government debt. America needs to sell more debt as its major buyer is stepping away from the market, which could lead to “higher for longer” borrowing costs for Uncle Sam.
Chart Of The Day… SpaceX IPO
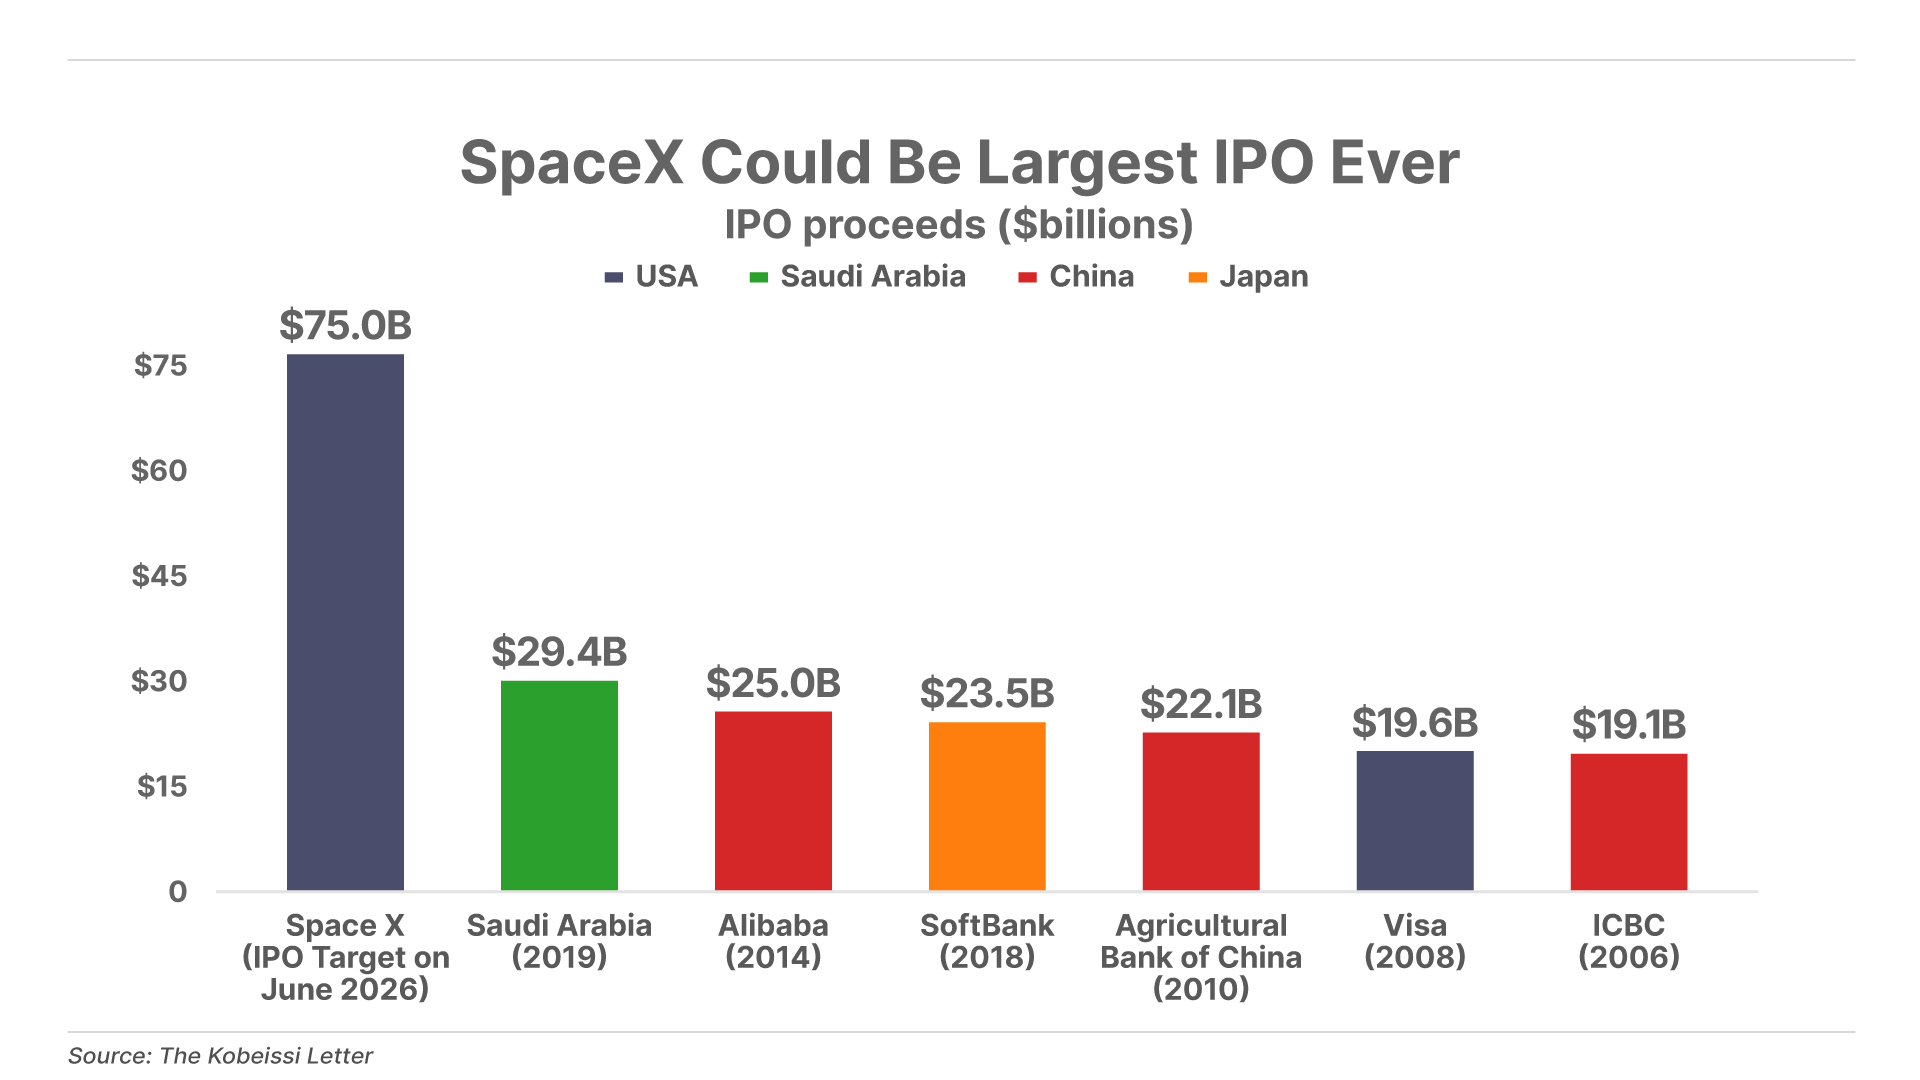
Elon Musk’s rocket business SpaceX is expected to raise as much as $75 billion in its initial public offering (“IPO”) as soon as next month, which would make it the largest IPO in history by far – roughly 2.5x larger than the previous record holder, Saudi Aramco. The company is also reportedly targeting a valuation of up to $2 trillion, which would make it the seventh-largest public company in the world, behind only Nvidia (NVDA), Alphabet (GOOG), Apple (AAPL), Microsoft (MSFT), Amazon (AMZN), and Taiwan Semiconductor Manufacturing (TSMC).
Poll – Mid-Term Elections And The Market
Mid-term election years are usually a coin flip for the performance of the S&P May through October – eight out of 14 years have seen positive returns, but during the losing years the S&P falls 13.6% on average.

Mailbag
“2029: The End of America”
James M. writes:
Porter,
I have been reading your work since 2008, when I joined Stansberry Research. It was a great investment. I still receive their material every week, although some of the players have changed.
Recently, Dan Denning or Tom Dyson recommended your new book. I got it, and I think it is great. The chapter on debt driving the gold pricing cycle was a completely new viewpoint for me. This really opens up a new way of looking at investments. Many things you recommended over the years are the backbone of the thinking in the book. Thanks for writing the book, and I wish you continued success.
Porter & Co. Comment: Thanks for sharing your thoughts. To get a copy of Porter’s book 2029: The End of America, which James writes about, click here. And please leave your own review.
“Corporate Bond Question”
Kathy D. writes:
Porter, reading Friday’s Daily Journal, “The Second Shock Coming Out Of Hormuz,” my alarm bells went off louder since I invested in a number of corporate bonds recommended by an affiliate two years ago. Am I understanding correctly that it would be unwise to own any corporate bonds? I know many of your readers are sophisticated investors, but if you could take a moment to say a few more words about this for those of us new to the corporate bond world, it would lessen my anxiety.
This is one of your most direct and best newsletters concerning the impending ramifications of the war with Iran yet. Thank you!
“Friday’s Essay: The Second Shock Coming Out Of Hormuz”
Kevin L. writes:
Porter,
Friday's Daily Journal essay was a great look at the world food chain. I have not come across any financial personnel (TV, print, radio, online) who have this take on the situation, and I mean that in a positive way.
I understand your timeline: the end of June for the Strait of Hormuz to be opened. But the impact should mean Trump has at least some understanding of this and will therefore do whatever it takes to get the Strait of Hormuz open, including obliterating the surrounding area. He still has at least four weeks to get this done.
With that said, I am 75% in cash and holding three different put positions on the QQQs.
“Questions About The Trading Club”
Leslie V. writes:
Hi Ross,
I am massively impressed with the first-year performance of The Trading Club, so hats off to you on this great performance. Now for the question. To take nothing away from the great result, but the market was mostly rising, which certainly helped most of your great picks, and this has me asking:
1. When you did all your testing prior to launching The Trading Club, did you test it in conditions that were less favorable? If you did, what were the results like?
2. You have rightfully been advising your followers that you see a market correction at some point in the not-too-distant future. I totally agree, and it has me wondering what changes in strategy you will employ in a falling market. I am sure all your grateful followers would appreciate you addressing this in advance of the pull-back, to give them confidence.
Again, my thanks for a great service and great result. Well done.
Ross Comment: Thank you for the kind words. Yes we’ve had a great run so far in The Trading Club, up 32.9% (as of today) in just under a year since launching on May 30, 2025.
And as much as I’d love to take all the credit for these returns, you correctly point out that the overall bull market has done a lot of the heavy lifting.
The same bull market was in place during the trial period where we experimented with the “beta” version of this trading strategy. So the reality is, we cannot rely on these historical returns to provide any indication of how The Trading Club strategy will perform when the tide inevitably shifts and today’s bull market gives way to the bear.
However, the one thing I can say is that I’m no stranger to bear market trading. I first started investing in 2005 and have now lived through the 2008 Financial Crisis, the 2018 “taper tantrum” panic, the 2020 COVID collapse, the 2022 tech bear market as well as the 2025 Liberation Day declines. And more recently, we navigated the recent volatility created by the outbreak of war with Iran with relative success in The Trading Club.
And each of these experiences has taught me one thing: markets can do the unexpected, and often when you least expect it. That’s why we built this strategy with durability above all else. By using things like put options, which can deliver outsized returns during a bear market that can potentially offset losses elsewhere in the portfolio. And by using things like covered calls, designed to generate consistent income and create a cash buffer that will also dampen downside risk. Finally, we’ve constructed a portfolio with a diverse basket of uncorrelated stocks, so that the entire portfolio is moving up and down based on the overall market.
All that said, when a real bear market inevitably strikes, there’s no getting around the fact that our portfolio will very likely take on losses. Our goal, however, is not to completely avoid this risk. The truth is that any strategy that eliminates all risk will also come with limits on long-term upside.
Instead, our goal is to better manage that risk versus a typical buy-and-hold strategy. That way, we aim to not only survive the bear market by limiting the downside, but to be in a position to capitalize on the incredible bargains unleashed during a market panic.
As always, we can’t guarantee exactly what the future will look like or how our strategy will perform. But one thing you can count on is that we’re putting our own money behind our ideas, and showing you every step of the way. So whether we win, lose, or draw you can know that we have skin in the game alongside you.
Porter & Co. Market Snapshot
| Price | Friday's Return | Year-to-Date Return | |
|---|---|---|---|
| S&P 500 Index | $7,408.50 | -1.24% | 8.22% |
| Gold per ounce | $4,555.80 | -0.16% | 5.16% |
| Bitcoin | $78,241 | 0.04% | -11.6% |
| Oil (West Texas Intermediate) per barrel | $105.42 | 3.29% | 80.2% |
| Berkshire Hathaway (BRK) | $723,821.00 | -0.46% | -4.1% |
| Porter's Permanent Portfolio | - | -0.41% | -0.1% |
| The Better Than Berkshire Index | - | -0.45% | 0.4% |
| Total Return | Annual Return | ||
| Porter & Co's Top Ranked* | 32.5% | 14.0% | |
| Yield | Friday's Change | Change Year-to-Date |
|
| U.S Treasury 30-Year Yield | 5.12% | 9 bps | 27 bps |
*A Complete Investor risk rating of 1 is defined as a "low risk, high allocation" security, while positions rated closer to a 5 are higher risk. Porter & Co.'s top-ranked positions include those rated either 1 or 2 in Complete Investor portfolio.
Porter & Co. Top Positions
| Publication | Ticker | Description | Total Return |
|---|---|---|---|
| Complete Investor | BWXT | BWX Technologies | 258% |
| Complete Investor | BTC/USD | Bitcoin | 187% |
| Complete Investor | PM | Philip Morris | 134% |
| Tech Frontiers | ROIV | Roivant Sciences | 130% |
| Tech Frontiers | SGMT | Sagimet Biosciences | 128% |
| Tech Frontiers | TGTX | TG Therapeutics | 114% |
| Distressed Investing | PTON | Peloton Interactive | 98% |
| Complete Investor | VNOM | Viper Energy | 93% |
| Complete Investor | WRB | W.R. Berkley | 89% |
| Tech Frontiers | SGMT | Sagimet Biosciences | 88% |
Prices as of 4:00 pm ET May 15, 2026
Please note: The investments in our “Porter & Co. Top Positions” should not be considered current recommendations. These positions are the best performers across our publications – and the securities listed may (or may not) be above the current buy-up-to price. To learn more, visit the current recommendations page of the relevant service, here. To gain access or to learn more about our current recommendations, call our Customer Care team at 888-610-8895 or internationally at +1 443-815-4447.