Issue #118, Volume #3

If You Want To Outperform, Use The Best Math
Inside Today’s Issue
In 1948, Bell Labs mathematician Claude Shannon published a paper in the Bell System Technical Journal, A Mathematical Theory Of Communication.
There were no book reviews. Not a single newspaper mentioned it. And I doubt there’s ever been any major media coverage about it – ever. But it changed the entire world.
After Albert Einstein, Shannon was the greatest mind of the 20th century. Shannon worked out precisely how much information a communication channel could carry. His theory inspired the entire digital world, because digital communication systems can carry immensely more information than analog systems. Every phone call, every file, every byte you have ever created or consumed in the last 30 years runs on his math.
And it turns out, you can use the same kind of math to optimize investments, too.
In 1956, a colleague of Shannon’s, a physicist named John Kelly, recognized that you could apply the same logic to other kinds of signal-to-noise problems – including financial scenarios. A gambler placing bets on tips faces the exact same problem as an engineer pushing a signal down a telephone line. Some of the information will be lost to noise. Some of the tips the gambler follows won’t pay off.
The question for the gambler is: How big can you size your bets so that your bankroll grows as fast as possible, without going bust because of the tips that don’t pan out? Kelly figured it out using Shannon’s math. The fastest rate at which you can grow a bankroll is governed by the quality of your information.
Signal is your investment edge. The noise is the risk you take – the volatility. To maximize the edge and to protect from the noise, you must bet in proportion to your edge and in inverse proportion to the noise.
At about the same time, a young mathematician named Edward Thorp figured out how to beat the dealer at blackjack by counting cards. Thorp knew to win he had to bet small when the odds weren’t in his favor and bet big when they were. But what he didn’t know was exactly how big to bet to maximize his winning over time. So Thorp asked to meet with Claude Shannon to figure it out. Shannon pointed him to Kelly’s formula… and the rest is some of the greatest wealth-building history in the world.
To begin, they built the first wearable computer and used it to beat casinos at roulette!
Then Thorp took his winning math to the biggest casino of all: Wall Street.
From 1969 to 1989, through his Princeton Newport Partners fund, Ed Thorp managed one of the greatest risk-adjusted track records in the history of finance, earning 15% a year with a Sharpe ratio that was over 3.0! The fund made money 227 out of 230 months, using a market-neutral strategy focused on convertible bond arbitrage. But the real secret to the fund wasn’t their edge in convertible bonds, which many other investors understood. Their edge was position sizing.
If you understand this math, you can take virtually any portfolio with an investment edge – whether it’s Erez Kalir’s biotechs or Warren Buffett’s compounders – and vastly increase the portfolio’s returns. You don’t take more risk, either. You take less.
For a single investment position, the Kelly formula gives you the growth-optimal fraction of your capital to commit. In plain English, it tells you how much to risk to make sure that your portfolio grows at the optimal possible rate. Invest that fraction and, over the long run, your money will grow faster than under any other strategy. It is a genuine mathematical maximum. It cannot be beat.
That perfection comes with a big risk. A full Kelly allocation is a Price Is Right mathematical cliff: if you go 1% over, you’ll lose everything. Remember in the old TV show: If your estimate of a consumer product’s price is above the actual price, you automatically lose? That’s the same thing with a Kelly number. It’s designed to show you exactly how much you can risk for optimal results. But… if you risk even a fraction more than that, you will begin to compound toward zero!
That’s why most of the quants who use this math in their portfolios don’t take “full” Kelly positions. They will allocate a fraction of what the Kelly math says is optimal. Thorp, for example, consistently used half Kelly position sizes. Thus, his fund compounded at 15% a year instead of 30%. But that conservative position sizing meant Thorp never experienced the huge drawdowns (like Buffett) that are always associated with extremely high-performing funds.
Let me show you how this works in practice.
Everyone knows Buffett had a real edge in the markets for decades. He picked consistently winning stocks and funded his Berkshire Hathaway portfolio with capital from his insurance companies. He was a bona fide investment genius. But, as I’ve described in a new book, Warren’s Mistakes, Buffett slowly lost his edge as he moved away from buying the best publicly traded companies and began to take entire businesses private.
To prove my theory, in 2025 I took his strategy and mapped it to a new portfolio (the Porter & Co. Better Than Berkshire Index) using only the highest-quality public companies. I took Berkshire Hathaway’s asset allocation and simply cloned it with higher-quality public market leaders:
- Progressive (PGR) and W.R. Berkley (WRB) where Buffett has GEICO and National Indemnity
- HEICO (HEI) where he has Precision Castparts
- The Home Depot (HD) where he has Mrs. B.’s Nebraska Furniture Mart
And, importantly, I used Berkshire’s position sizing – its existing asset allocation.
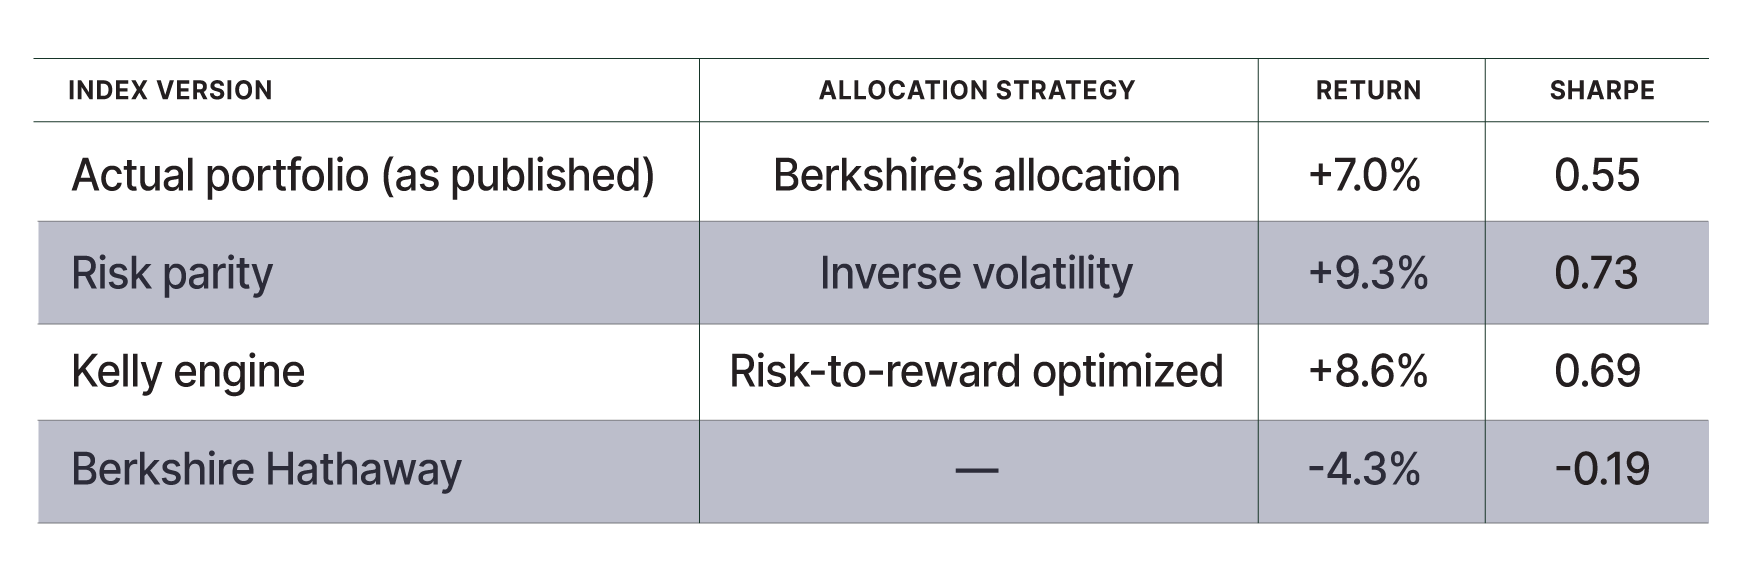
Since its launch, my version of Berkshire has returned 7.0%, with a Sharpe ratio of 0.55 while Berkshire itself returned only -4.3% in the same period. In its first year, Better Than Berkshire beat Berkshire even as a soft insurance market held down its absolute return, using Buffett’s own structure, filled with better businesses. And because the Better Than Berkshire Index is a fully allocated portfolio from a set point in time, using only one asset class (unlike Porter’s Permanent Portfolio which uses four asset classes), we can test whether using different position sizes would make a meaningful difference to returns.
Rather than using Berkshire’s own position sizing, consider a second approach: risk parity. You measure the volatility of each individual position and you change the position size so that you’re putting the same amount of capital at risk in each position. This gives more exposure to the steady names and less to the jumpy ones. (TradeStops software makes doing this kind of position sizing easy and it’s something I’ve recommended for years.)
If we’d used risk parity to do our allocations, the same exact Better Than Berkshire Index – the exact same stocks, bought at the exact same prices – would have returned 9.3% with a Sharpe ratio of 0.73.
Risk parity position sizing will make you more money, with less risk.
That’s amazing, isn’t it? A basic mathematical allocation system will beat Buffett’s allocation! And the truth is, risk parity position sizing beats virtually every investor we’ve ever tested it against, including yours truly across my 30-year track record.
And here’s the best part. The Kelly position-sizing engine will beat risk parity, over time.
Kelly doesn’t size by risk (volatility) alone. It uses a more sophisticated approach that instead optimizes positions by measuring the risk-to-reward outlook inside each position. It figures out how much signal (likely upside) is in each position and how much noise (volatility). The algorithm is expected return divided by risk squared.
Unlike in blackjack, the reward with investing isn’t known, but it can be estimated by looking at forward earnings forecasts. And while any given forecast is likely to be wrong, consensus forecasts (the average of the forecasts) are remarkably accurate. So we estimate reward by looking at the consensus earnings growth, plus the dividend the company pays while you wait.
What happens when you use a Kelly engine to optimize the position sizes for the exact risk-to-reward of each position? Allocated in that way, my Better Than Berkshire Index has returned 8.6% since inception, with a Sharpe ratio of 0.69. Over a full cycle, optimizing by risk and reward together is the approach that compounds fastest. In this first, insurance-dragged year the two disciplines finished neck-and-neck, both comfortably ahead of Berkshire’s own weighting.
Keep in mind, the stocks we put in the index didn’t change. The timing, the entry prices, etc., were all the same. The only thing we changed was the size of each position.
I know these small differences may not look meaningful. But compounded over time the resulting investment performance will be enormous. Correct position sizing is, by far, the best way to increase your actual returns in any diversified portfolio.
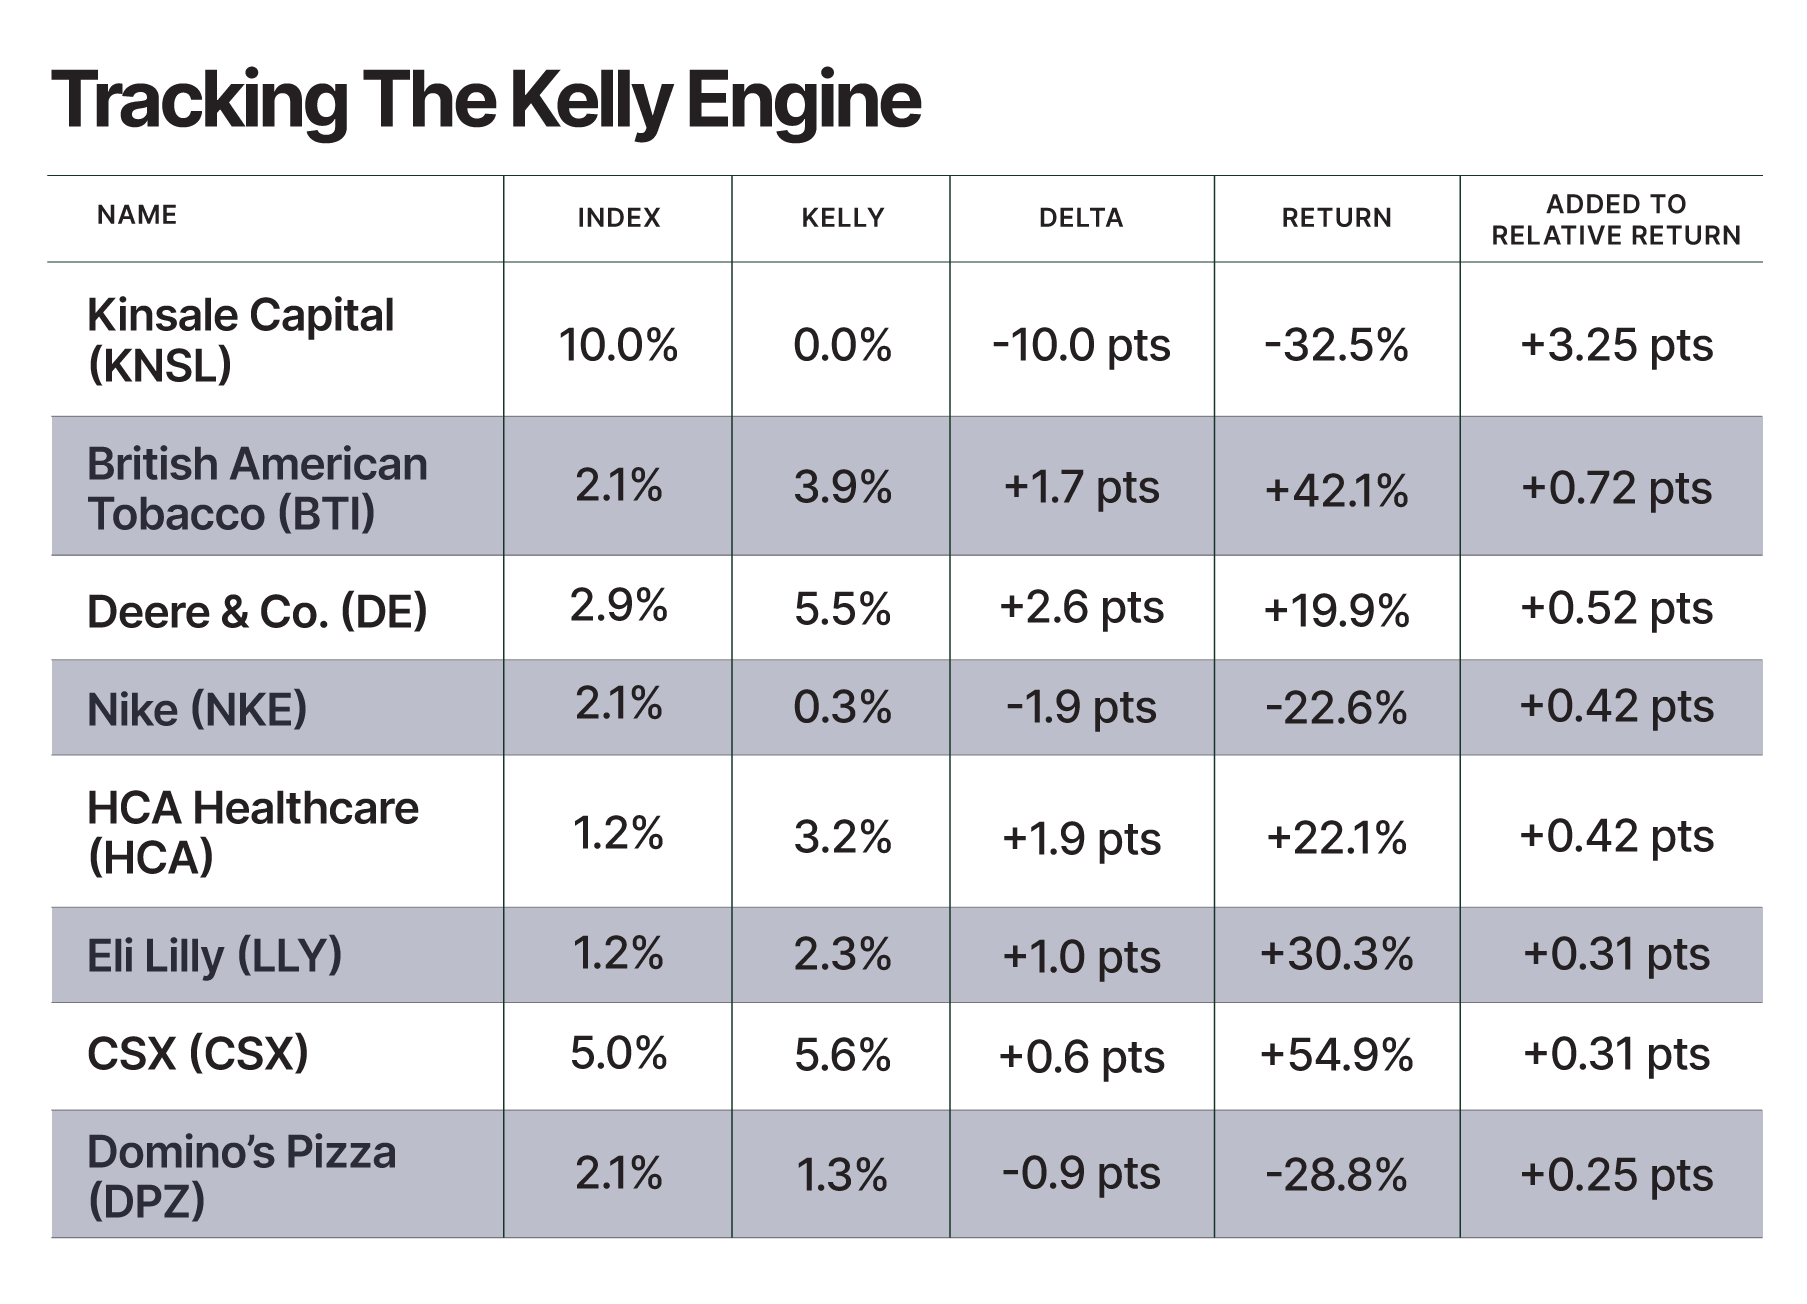
The Kelly engine earns its outperformance by leaning into the businesses where the earnings outlook is strongest relative to risk. It leaned away from the insurers caught in the soft-pricing reset – cutting Kinsale Capital (KNSL), the single biggest drag on the year – and leaned into the low-volatility compounders with the strongest earnings outlook: British American Tobacco (BTI), Deere & Co. (DE), HCA Healthcare (HCA), Eli Lilly (LLY). It is the same discipline my dad used on Coca-Cola (KO) without ever writing an equation: own more of the surest compounders, less of everything else, and let time do the rest.
Using a Kelly engine for position sizing forces me to quantify exactly what I expect to earn and how much risk I am taking to earn it.
This is one of the tools I’ll be using when we re-vamp Tech Frontiers, our biotech product. Don’t miss the first issue, which will be out Saturday, August 1.
To learn more about Ed Thorp, I highly recommend his incredible autobiography, A Man For All Markets. And to learn more about the math behind Kelly positioning, I recommend reading Ed Thorp’s paper “The Kelly Criterion In Blackjack, Sports Betting, And The Stock Market.”
Tell me what you think of today’s Journal: porterstansberrydirect@gmail.com
Good investing,
F. Porter Stansberry
Stevenson, Maryland
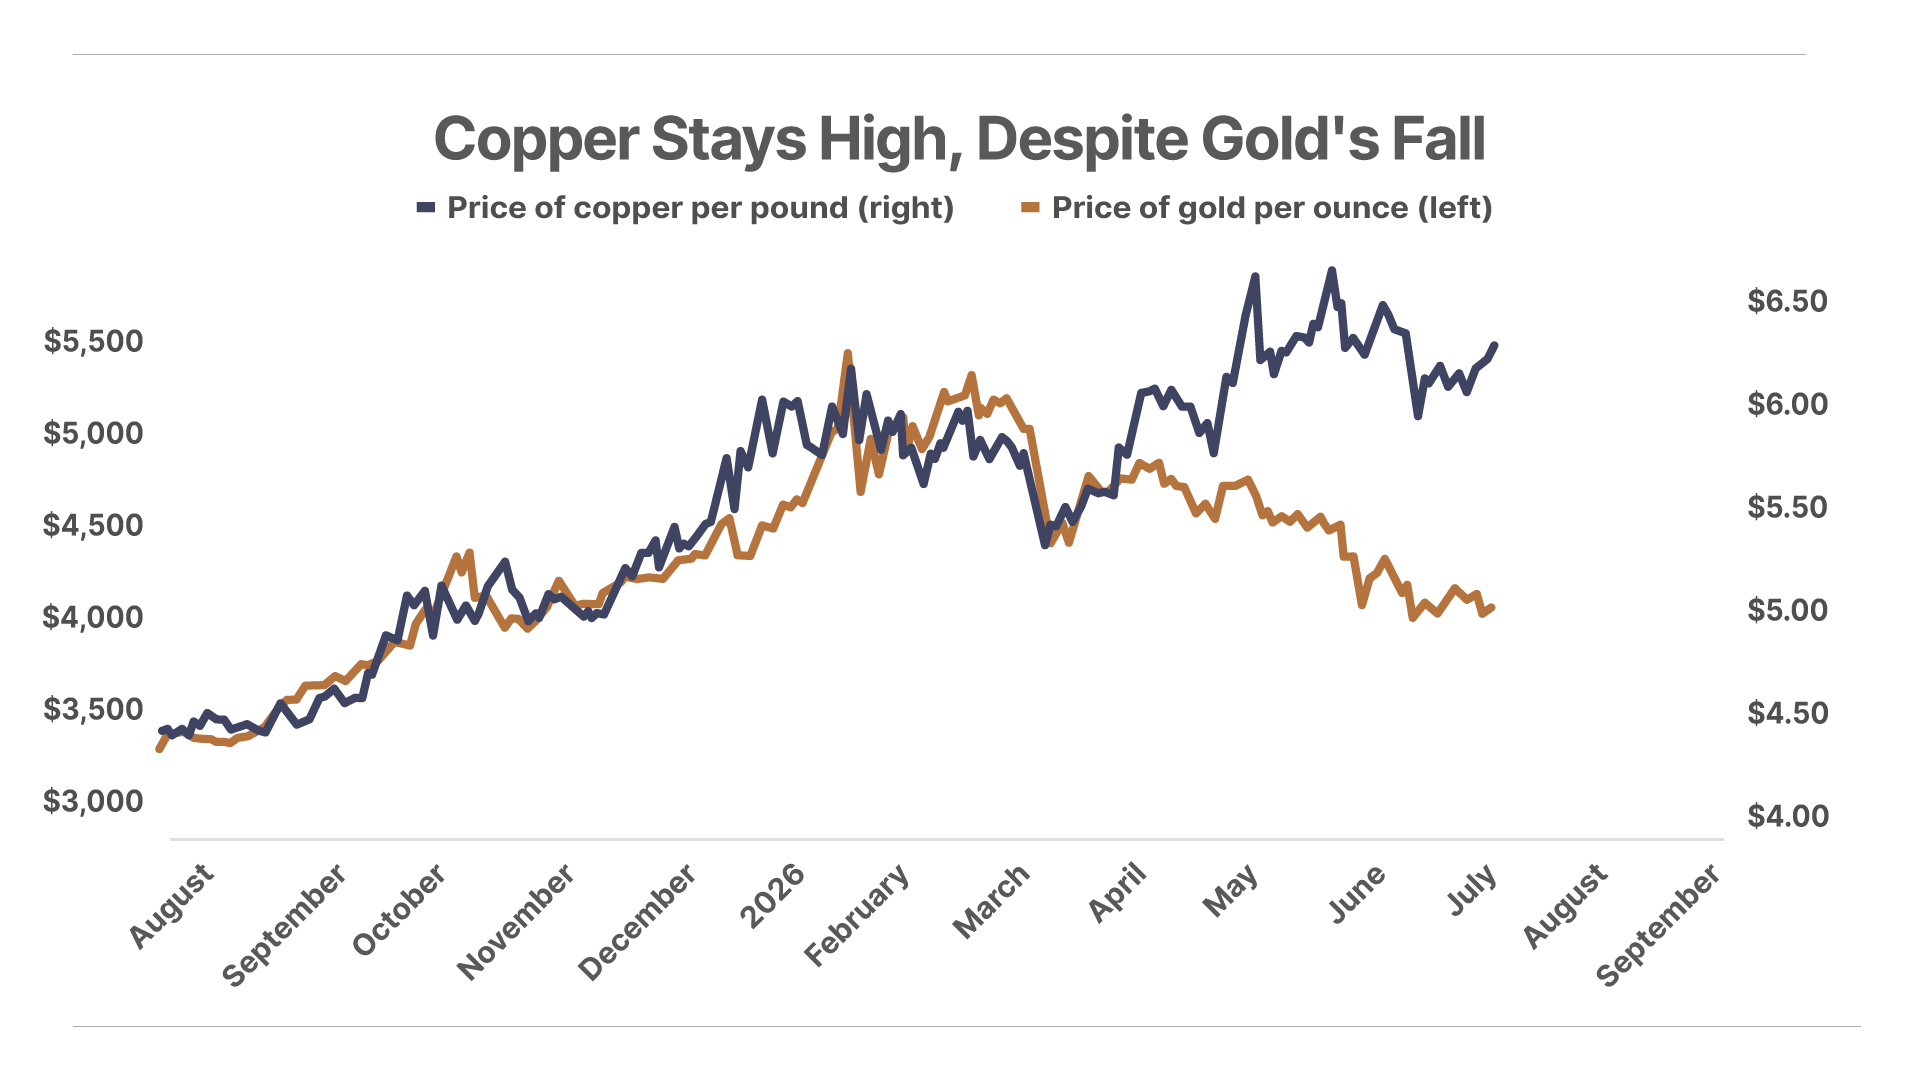
1. Copper isn’t buying gold’s breakdown. After rallying strongly together through most of 2024 and 2025, gold has fallen roughly 28% from its January 29 record near $5,595 an ounce – its worst quarterly decline in 13 years – while copper is up nearly 10% over the same period and within striking distance of an all-time high. Gold’s recent decline appears to be a reaction to extreme sentiment and crowded positioning, not the end of the commodity bull market.
2. The student-loan crisis is here. The latest data from the New York Fed shows 2.6 million borrowers defaulted on their student loans in Q1, a significant jump from 1 million in Q4. There are now 7.7 million borrowers in default on student loans, with a combined balance of $180 billion. And nearly one in four borrowers is at least 90 days late on payments. The burden will ultimately fall on taxpayers given the government guarantees behind many of these loans.
3. Warren Buffett, not Greg Abel, was responsible for Berkshire Hathaway’s Google investment. “I initiated it,” the 95-year-old chairman told CNBC’s Becky Quick of Berkshire’s move into Alphabet (GOOG). Berkshire first disclosed the stake in Q3 2025 and has since built it toward $30 billion, including a $10 billion private placement in June that helped fund Alphabet’s AI buildout – now one of Berkshire Hathaway’s largest equity positions. Ironically, despite admitting that he erred by not buying Alphabet sooner, Buffett also said he still isn’t fully sold on the company – which we recommended in Complete Investor in September – he ranked it below at least four or five other Berkshire businesses.
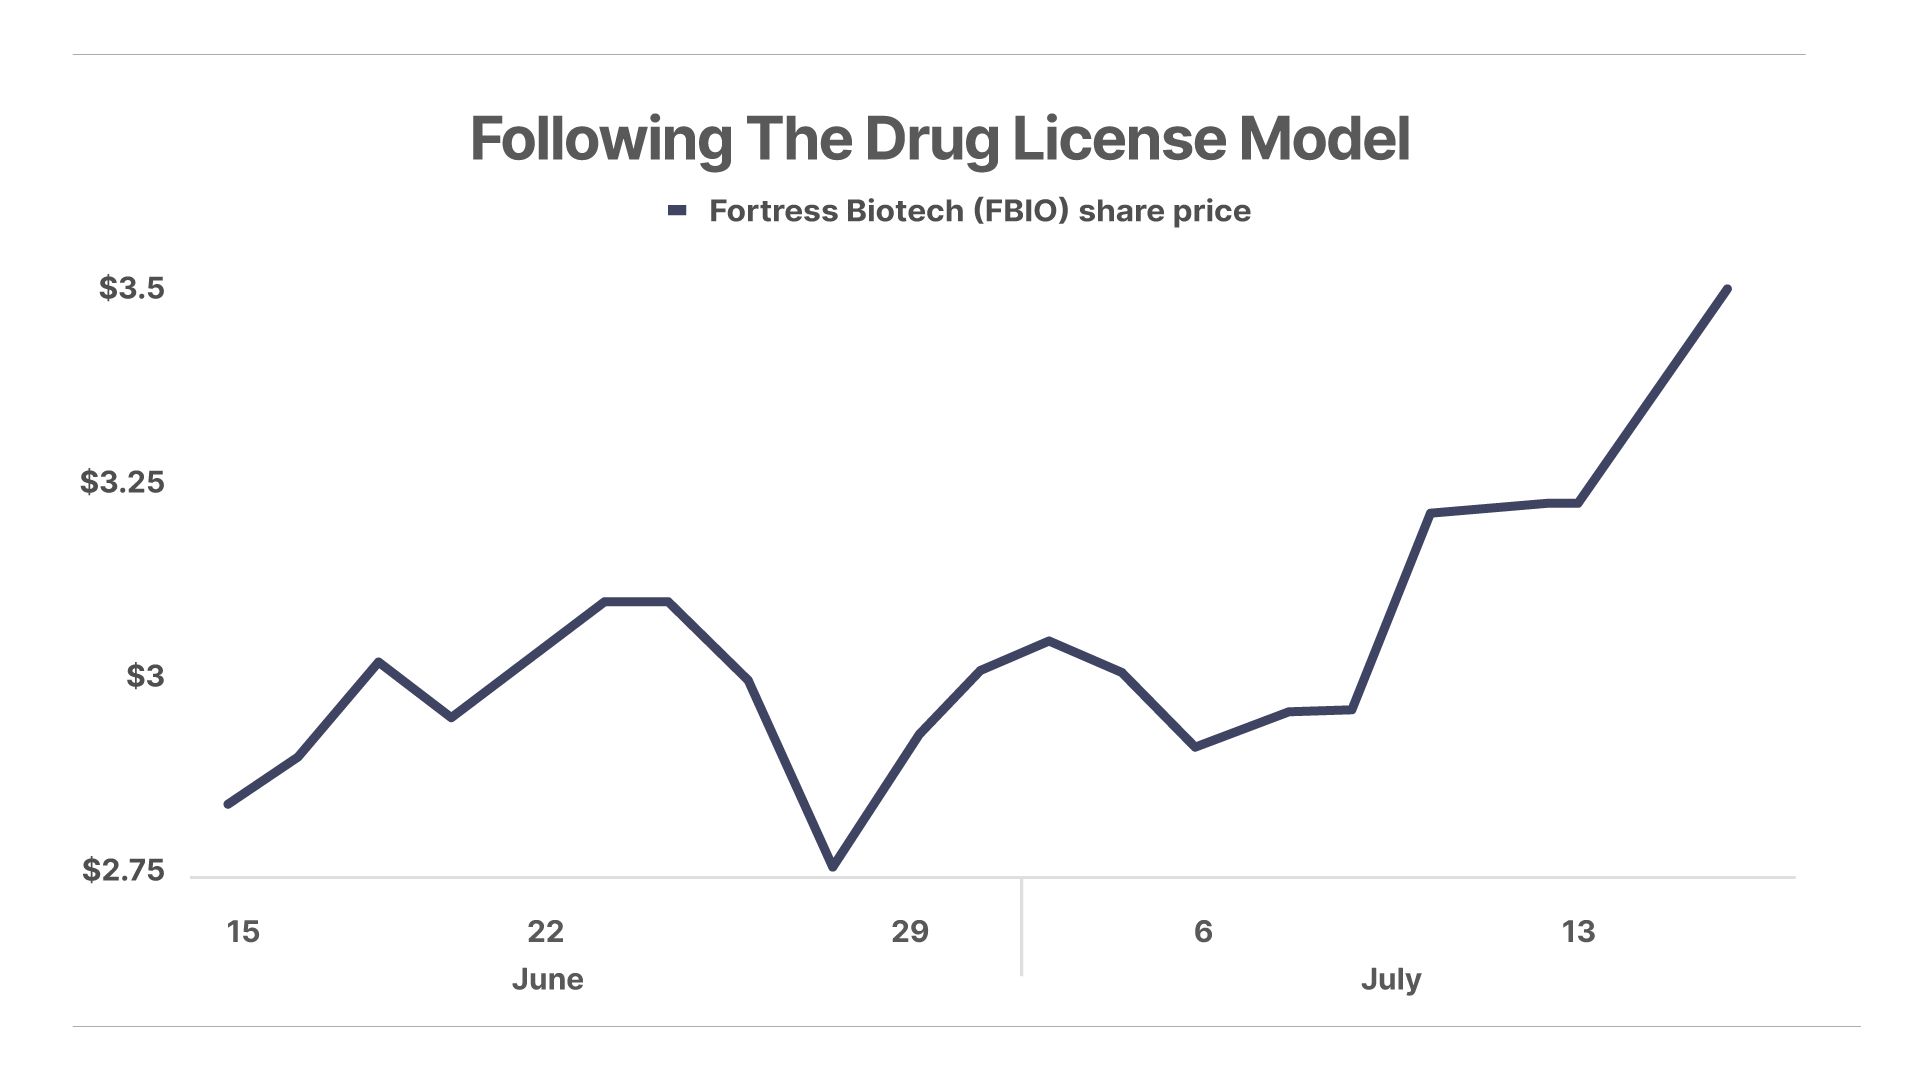
Recommended by Tech Frontiers in September 2025, shares of drug-licensing firm Fortress Biotech (FBIO) are up 26% for the month.
“So-Called Charitable Giving”
Yesterday in the Journal, Porter pointed out the major flaws in Warren Buffett’s philanthropic approach.
Gary B. writes:
“Your take is excellent. Unfortunately so many superwealthy give their fortunes to liberal philosophies which are at war with capitalism and the actual advancement of the success of the USA.”
Tim S. writes:
Thanks, Porter. One of your best ever – I’ve been reading you for about two decades.
I love the idea of giving away money to people who will be good stewards of it. I am constantly bombarded by organizations begging for money. I silence most of them by stating that we never give money to any organization unless we first see an independent auditing of the organization’s finances. Almost none ever reply. Of those that do, the money they collect almost always goes to either oversight (bureaucracy) or fundraising (give us more money so we can find even more suckers to give us their money, too)!
Finding a charity that is a good steward is always a thrill.
Kevin L. writes:
Another great piece on Buffett today and on so-called charitable giving in general. It’s unfortunate that smart people allow their hard-earned money to go to anti-capitalist “causes”. For me, I have been able to give partial scholarships to 5-7 students at the Catholic high school that I attended. There is always the concern of liberalism sneaking around the hallways, but on a recent visit, I was glad to see a business section of classrooms with a stock ticker in the hallways, and also the establishment of a real estate course.
As for the biotech area, I have no doubt that you will handle it well. I look forward to your recommendations and portfolio management of what Erez set up. The reality is that all we need is three to four promising companies, knowing that only a portion of the portfolio should be in biotech.
Porter & Co. Market Snapshot
Porter & Co. Top Positions
Please note: The investments in our “Porter & Co. Top Positions” should not be considered current recommendations. These positions are the best performers across our publications – and the securities listed may (or may not) be above the current buy-up-to price. To learn more, visit the current recommendations page of the relevant service, here. To gain access or to learn more about our current recommendations, call our Customer Care team at 888-610-8895 or internationally at +1 443-815-4447.