Issue #98, Volume #3

Even The Best Case Shows The Energy Shock Remaining High
Inside today's Daily Journal…
|
Editor’s note: Today, Porter has turned the Journal over to his Porter & Co. colleague, analyst Ross Hendricks – editor of The Trading Club – who explains why even if the recently announced peace agreement between the U.S. and Iran holds, oil supplies, energy markets, and prices will remain tremendously disrupted.
Here’s Ross now…
In 1935, Austrian physicist Erwin Schrödinger proposed a famous thought experiment that came to be known as the Schrödinger’s Cat Paradox.
The experiment highlights the bizarre nature of quantum physics, where particles exist in a superposition of all possible states until they are observed or measured, and only then does the probability distribution collapse into a definite state.
Schrodinger devised a scenario where a cat is sealed in a box along with radioactive material, a Geiger counter (for measuring radioactivity), a vial of poison, and a hammer. If the Geiger counter detects radioactive emission, it triggers the release of the hammer to shatter the vial, which kills the cat. But radioactive emission is a quantum event, governed by probability rather than certainty. This makes it impossible to determine whether radioactivity was released until opening the box and making the observation.
Thus Schrödinger proposed that the cat inside the sealed box must also exist in a superposition: simultaneously alive and dead until someone opens the box and looks.
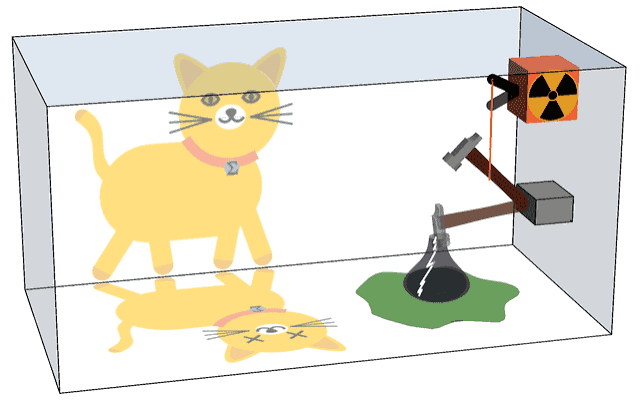
The paradox was meant as an exercise in reductio ad absurdum to highlight the strange reality of quantum physics which, when taken to the extreme, results in a living creature being both dead and alive at the same time. It has since become one of the most enduring thought experiments in the philosophy of physics, forcing scientists to grapple with the nature of reality and the boundary between the quantum and classical worlds.
But it turns out that it’s also the perfect analogy for the state of modern-day geopolitics.
Schrödinger's War: Iran Edition
Much like Schrödinger’s cat, the conflict with Iran has persisted in a superposition of equal probabilities of war and peace. Every social media post from President Donald Trump functions as an observation that briefly forces the conflict into a defined state, only for it to dissolve back into superposition within hours when Iran responds, Israel acts unilaterally in Lebanon, or Trump contradicts his own statements. One minute he’s threatening to “destroy an entire civilization” and the next he’s announcing “a great day for World Peace!”
The system has no stable ground state because neither Trump nor the Iranians have been willing to concede on the key details of a lasting peace plan. They periodically reach “agreements to agree” in theory, only to have the deal fall apart and missiles flying once again. The original “mostly peaceful” ceasefire agreement in early April has been punctuated by bombings, missile and drone attacks, and most recently a U.S. helicopter being shot down in the Persian Gulf. All the while, President Trump has assured us that the ceasefire remains in place.
One of the key sticking points so far has included Iran’s insistence on holding permanent control over the Strait of Hormuz, including its right to collect fees from transiting ships – a defeat Trump cannot tolerate.
Another issue complicating the matter are the other key players in this conflict, including Israel and Iran’s proxy militia group Hezbollah. Iran has insisted that any peace deal extend to the conflict in Lebanon, which in turn requires compliance from Hezbollah and Israel, neither of which are involved in the negotiations.
With that backdrop in mind, let’s review the latest memorandum of understanding (“MOU”) announced last night, which is yet another real-time exercise in Schrödinger’s uncertainty. No formal text of the deal has been released, but the public statements from the parties involved already show clear signs of contradiction.
In an interview with The New York Times last night, President Trump stated that the deal would include “permanently toll-free” movement of ships through the Strait of Hormuz. Simultaneously, Iran’s Fars News Agency claims the agreement allows for only 60 days of free transit, after which Iran plans to generate revenue by charging ships for safety, environmental, and insurance services.
Then, there’s the Lebanon paradox. A statement from Iran’s Supreme National Security Council last night specifically referenced an immediate and permanent ceasefire in Lebanon as part of the MOU, noting:
Based on the agreements reached, the war and military operations on all fronts, including Lebanon, will end immediately and permanently as of tonight.
Around the same time, Israeli’s Maariv news agency reported that Israeli Prime Minister Benjamin Netanyahu informed Trump that Israel will not pull Israeli forces from Lebanon and does not consider itself bound by the Lebanon clause in the U.S.-Iran agreement.
In another twist, the Iranians claim that the deal includes a $12 billion payment on $24 billion of frozen Iranian funds before the signing of the deal on Friday. But in a statement to news platform Axios, a U.S. official claimed that no frozen funds will be released “until Iran meets its obligations.”
Finally, it’s worth noting that two of the most critical details of the long-running conflict, uranium and sanctions, remain unresolved and will be subject to further negotiation following the current MOU. And in yesterday’s interview with The New York Times, Trump warned that he would resume military strikes if Iran fails to deliver a final nuclear deal.
That cat, it seems, remains very much in the box. Color us skeptical that it survives through the planned signing ceremony in Switzerland this Friday, at least if history is any guide. The graphic below shows the dozens of “very close” peace deals that have been announced over the last three months:
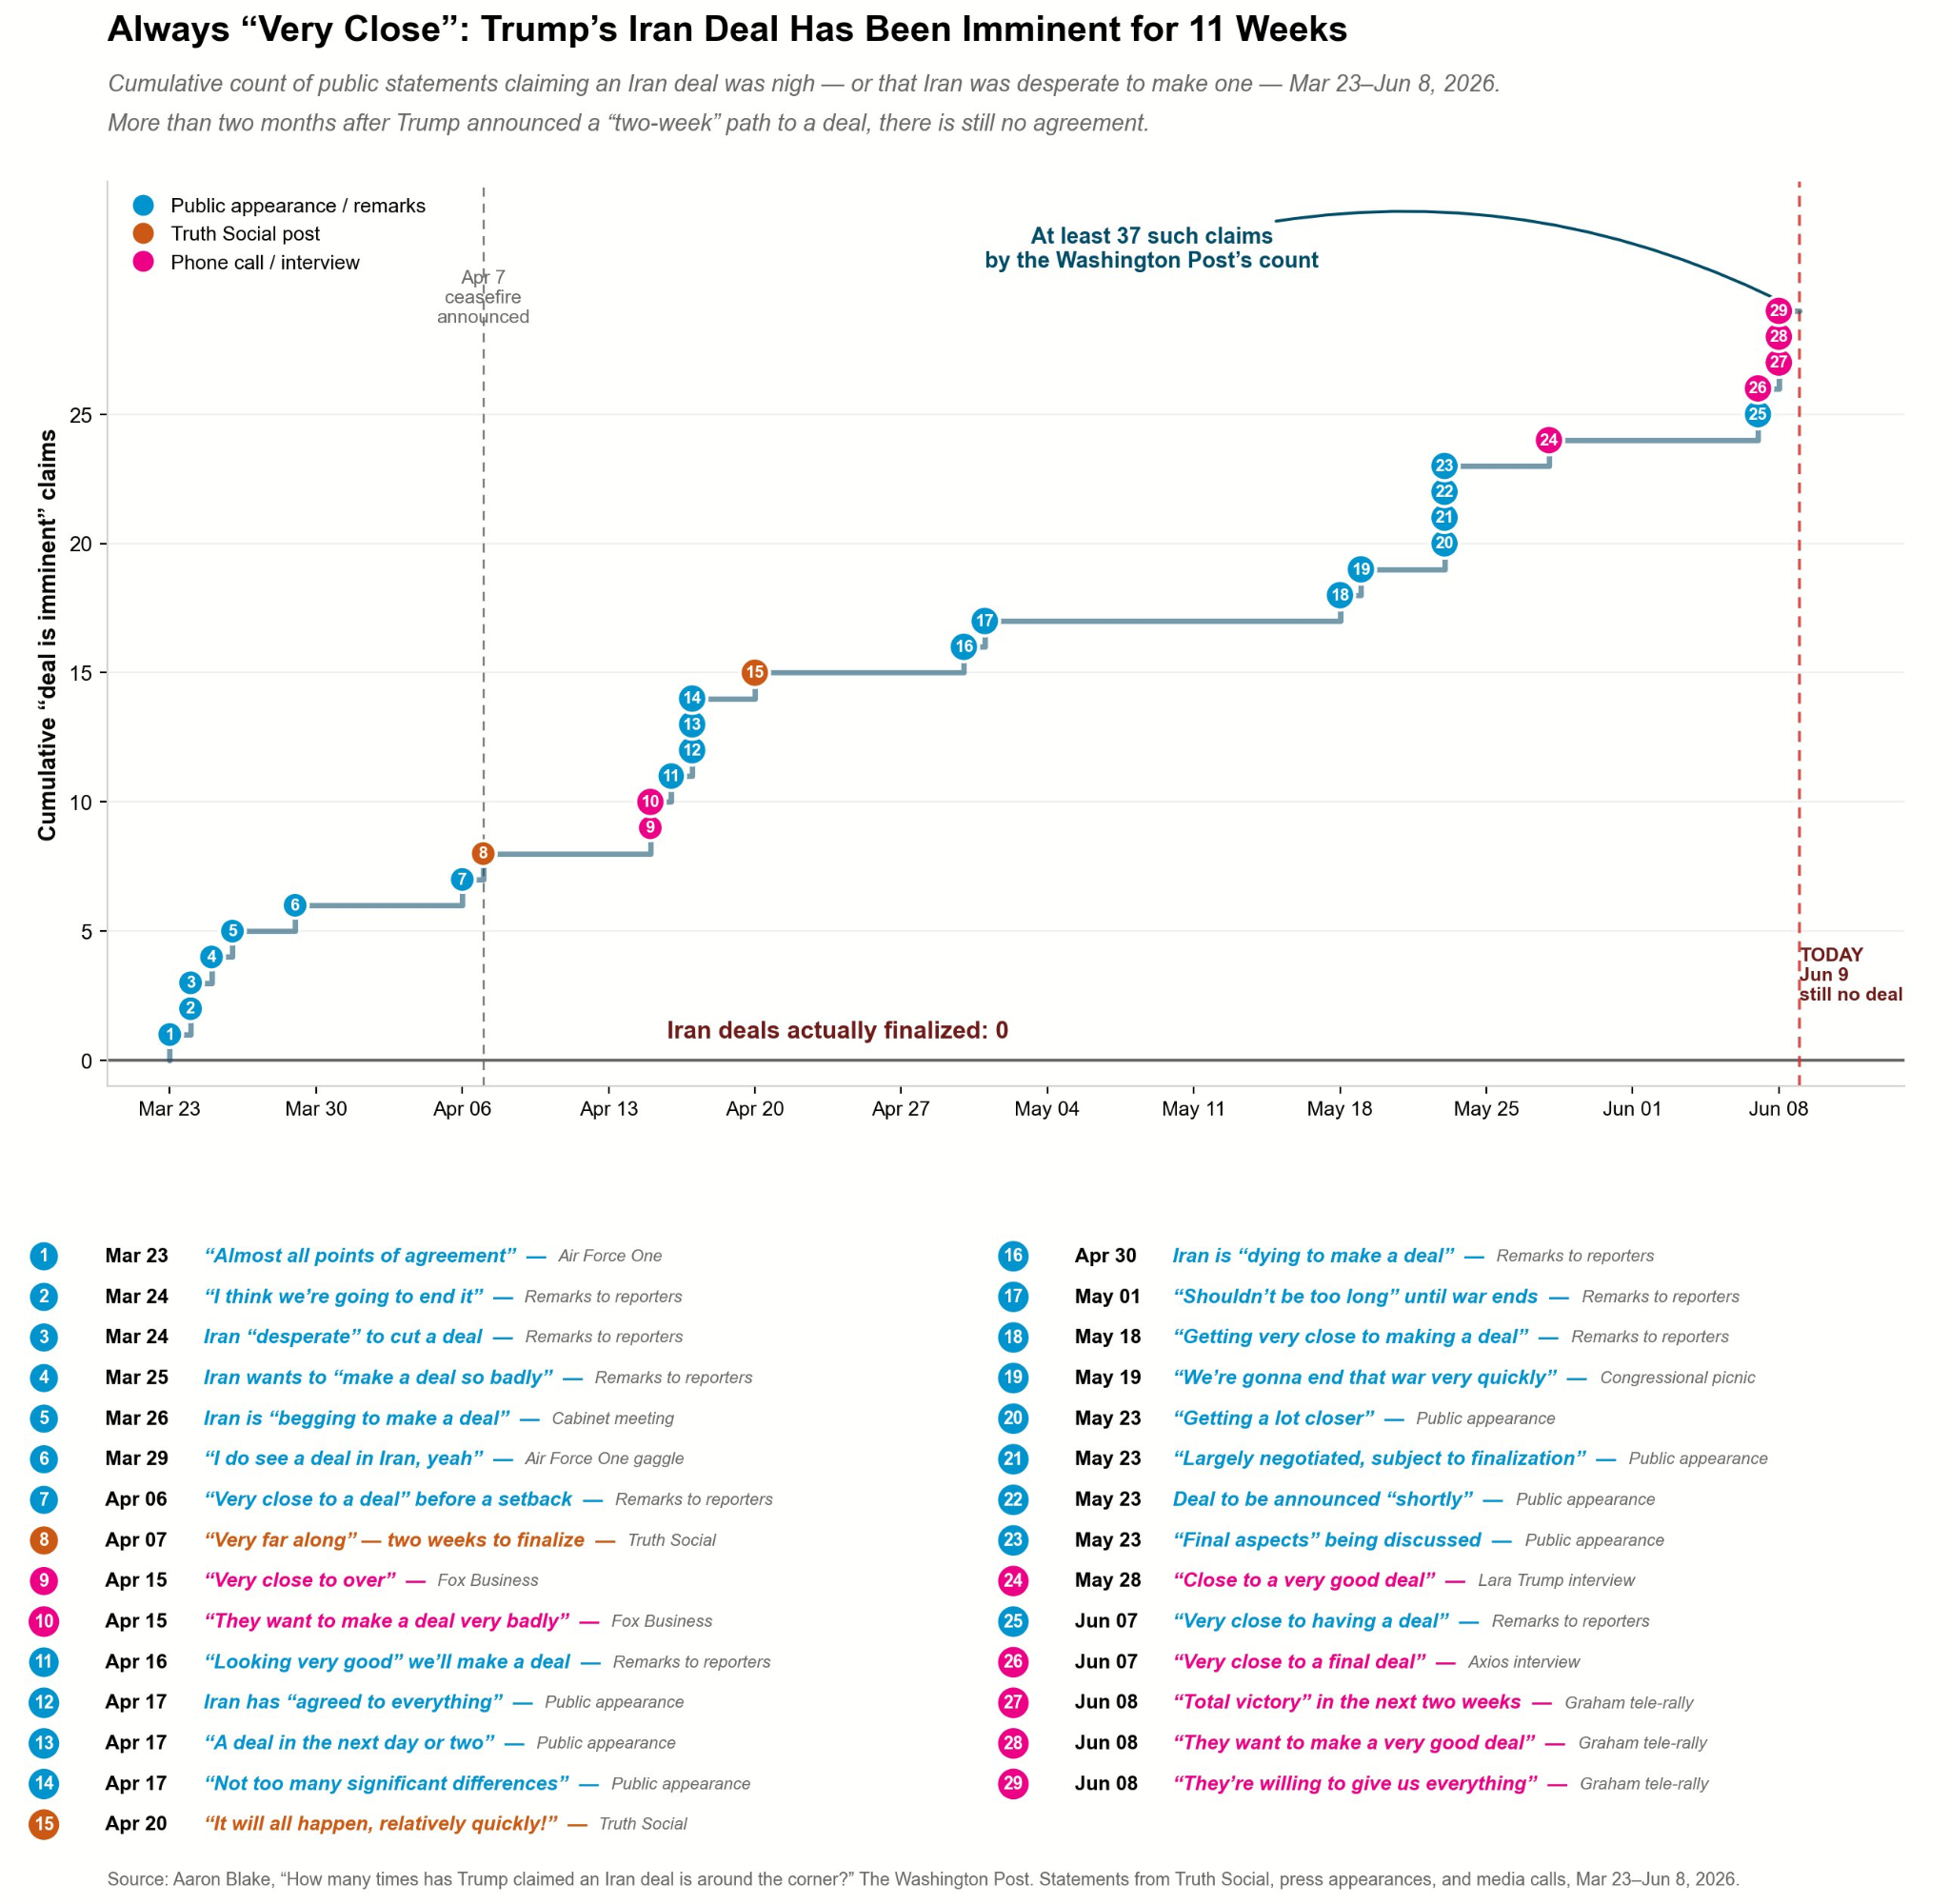
Even as we expect the negotiations to exist in a continued state of quantum uncertainty, there’s one thing we can measure the absolute precision of: oil supply and inventories. As we’ll show next, the world’s energy supplies and markets won’t escape the fallout of this conflict unscathed.
Even in the most optimistic scenario of an imminent and lasting peace deal, we will likely experience a multi-year period of higher energy prices and sticky inflation. But if the negotiations stall, we’re only weeks away from a crippling energy shock that could unleash a repeat of the 1970s-style stagflationary spiral.
Why Energy Prices Will Stay Higher For Longer
Setting aside all future projections, the world has already experienced the biggest oil shock of all time.
Based on data from the International Energy Agency (“IEA”), the Iran War has resulted in production shut-ins across the Middle East of 13 million barrels per day (b/d) since early March. That represents a daily loss of 12% of global oil supply, which has drained more than a billion barrels of oil from global inventories.
The closest historical analog for this supply shock is the 1973 OPEC (Organization of the Petroleum Exporting Countries) embargo, which removed about 4.4 million b/d of oil from the market, representing about 8% of global supply at the time. That supply disruption lasted for five months, and resulted in a global inventory drawdown of around 500 million barrels.
Now, there’s one key difference between today and the 1970s. Back then, countries around the world didn’t have strategic petroleum reserves (“SPR”), which were created in response to the 1973 oil shock. Without that buffer, the market immediately felt the full brunt of an 8% hit to global oil supply, which sent prices skyrocketing from $3 per barrel to $12 per barrel. The end result was a deep recession and a 43% decline in the U.S. stock market from 1973 - 1974.
SPRs have been the saving grace that have, at least so far, prevented a similar outcome this time around. In early March, the IEA coordinated the world’s largest SPR release of 400 million barrels – but this is merely a temporary solution that has delayed rather than eliminated the impact of this crisis.
Here’s the key thing to know about oil inventories: to facilitate fluid movement through the system, a minimum level of volume must remain in place as working capacity.
Now, in the world where the peace negotiations once again stall and the world continues losing 13 million b/d of supply, we’re only two and a half months away from reaching the operational limit on working oil inventories, based on a recent analysis from JPMorgan:
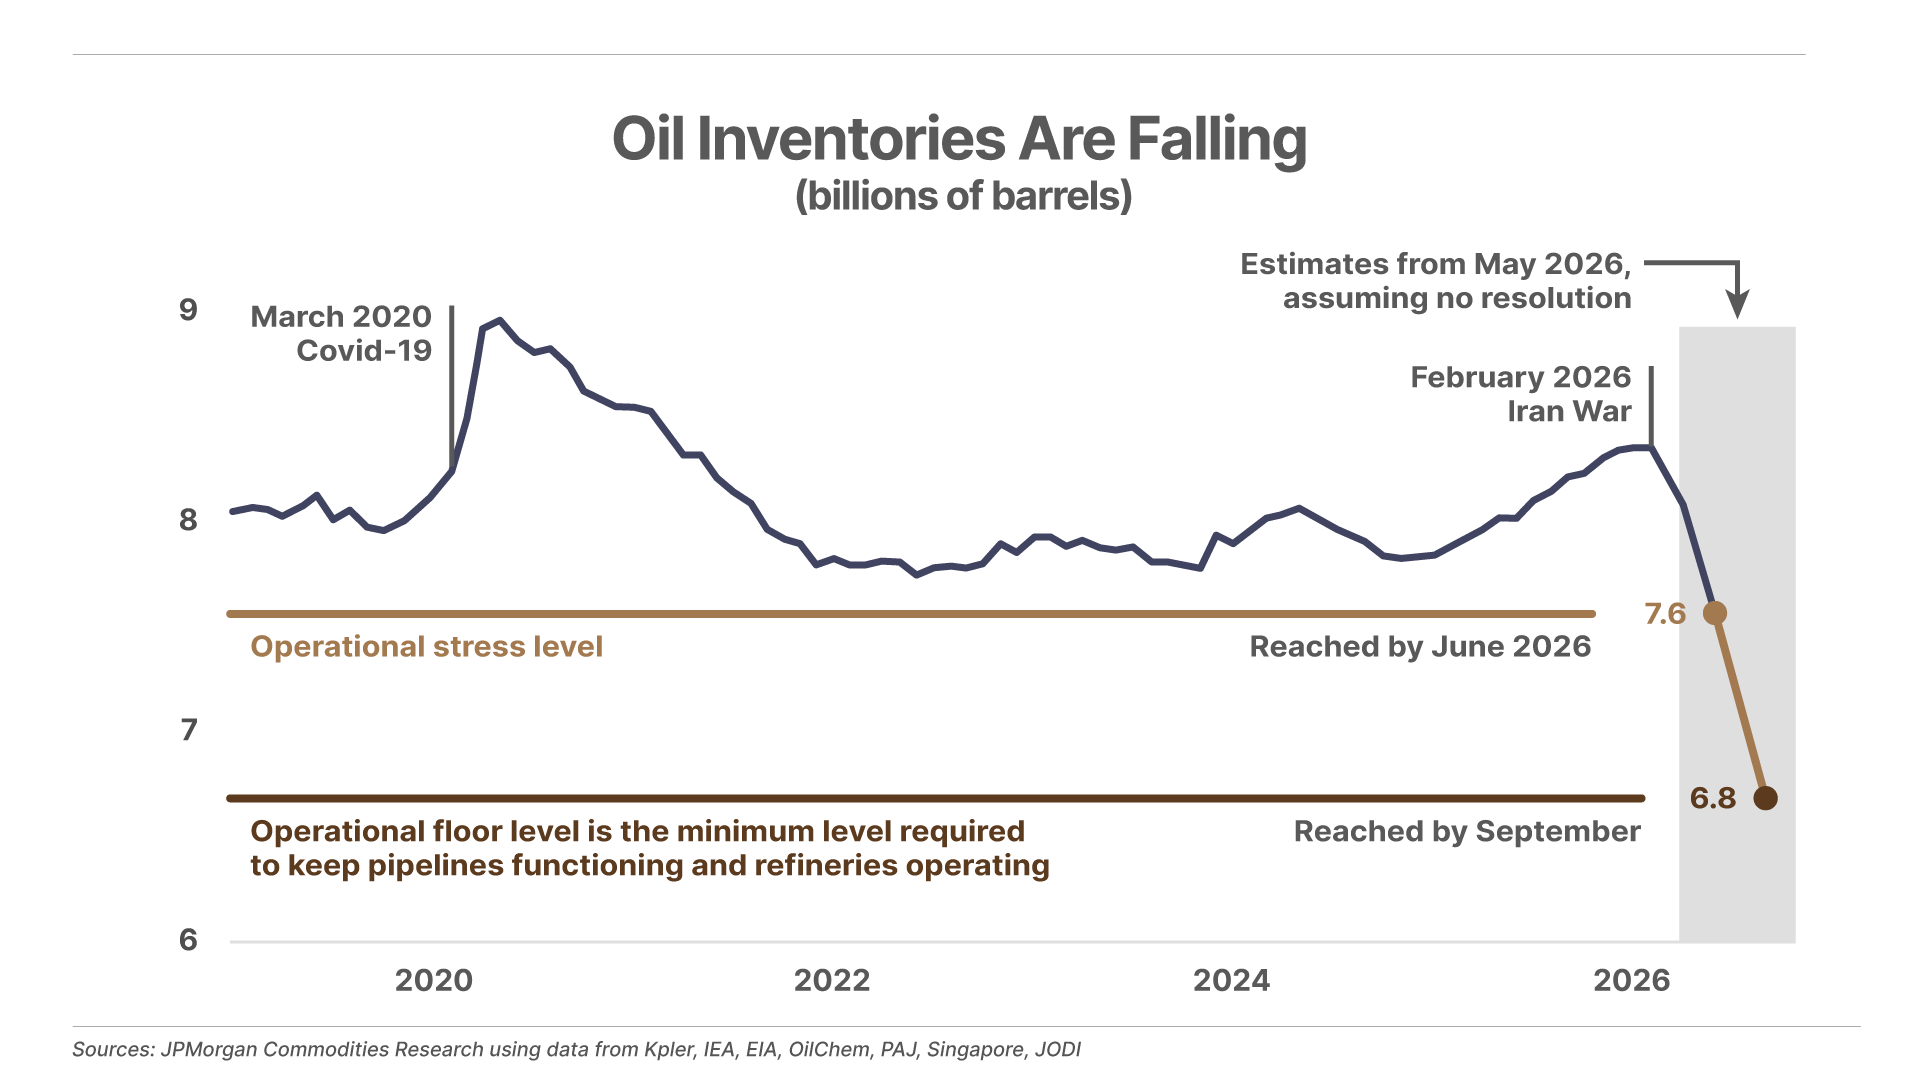
In this worst-case scenario, by September the market will lose its buffer of excess inventory and begin bearing the full brunt of a loss of 12% of global oil supply. That would represent a supply shock 50% larger than the 1973 OPEC embargo, and likely send oil prices to $200+ per barrel.
While we’re not forecasting this outcome, it’s worth keeping in mind to appreciate the stakes involved with this conflict, and how little time remains to reach a lasting peace deal.
Now, let’s consider the best-case scenario.
For that, we turn to the latest analysis from the IEA, which assumes that the free flow of shipping traffic through the Strait of Hormuz resumes by the end of this month. The IEA projects a 1.8 million b/d supply deficit through the remainder of 2026, which would result in another 300 million barrels of inventory drawdowns on top of the billion barrel deficit already accumulated.
Even if the Strait reopens, the global oil supply remain in a deficit for the next six months for two main reasons:
The first reason is the wide-scale infrastructure damage across the Persian Gulf. Oil loading docks, storage containers, and even some production fields have come under attack. Restoring these damaged facilities to pre-war capacity will take months, acting as a bottleneck on production and export capacity in the meantime.
The second reason is production shut-ins currently impacting 13 million b/d across the various Persian Gulf oilfields. Forced shut-ins can cause significant damage to subsurface reservoirs. Restoring production isn’t like flipping on a light switch. It can take anywhere from several weeks to several months to fully restore the reservoir to optimal conditions.
But even getting to the starting point of restoring production will take months. That’s because there are currently 500 shipping vessels trapped behind the Hormuz blockade. When they get the green light to exit, it will unleash the world’s largest traffic jam. With hundreds of tankers backlogged, most analysts estimate it will take weeks to clear out the ships that are now waiting to pass through the strategic waterway.
From there, these tankers will then take anywhere from 30 to 90 days to offload their existing cargoes before returning to pick up their oil from the maxed-out storage tanks in the Persian Gulf. And only once those storage tanks begin drawing down, can Persian Gulf countries begin restarting their shut-in oilfield production.
These are all features of this conflict that did not exist during the 1973 OPEC embargo, which ended after just five months without any lasting damage or logistical chaos. But there is one feature of the 1970s that will be very much in play in 2026: a persistent drag on available oil supply from filling up SPRs in the wake of this conflict.
In response to the 1973 oil shock, the IEA was formed in 1974 to coordinate energy security among Western nations. The agency required member countries to maintain emergency SPRs equivalent to at least 90 days of net oil imports to combat future supply disruptions. This led to approximately 500 million barrels of incremental oil demand flowing into SPRs across the U.S., Japan, and most European countries through the remainder of the decade.
This persistent, incremental call on oil supplies was a key factor in keeping prices higher beyond the initial supply shock. So even though the OPEC embargo lasted only five months, the subsequent accumulation of spare supply into SPRs led to a decade-long rally in oil prices, which remained stuck persistently above $12 per barrel (up 300% from pre-1973 prices), and reaching as high as $40 per barrel.
The same dynamic will be in place going forward, as countries around the world race to secure future stockpiles. This includes the U.S., which has drained its strategic reserves down to 350 million barrels, down from a peak of 700 million barrels and nearing the lowest levels since the early 1980s.
Assuming the world simply seeks to rebuild global oil inventories to pre-war levels will require approximately 1.3 billion barrels of incremental demand. But if history is any guide, this conflict will leave lasting scars about the vulnerability of economies around the world to geopolitical shocks, leading to larger SPRs going forward. That could lead to 1 million to 2 million b/d of incremental demand that persists for the next half decade, keeping energy prices higher for longer.
Finally, it’s worth noting another striking similarity between today’s macroeconomic backdrop and that of the 1970s.
In the lead up to the 1973 OPEC embargo, the U.S. economy was already running red hot after half a decade of high inflation – a result of the “guns and butter” diplomacy of the time, which included the deficit spending on the Vietnam War combined with a massive expansion of social welfare as part of the Great Society programs.
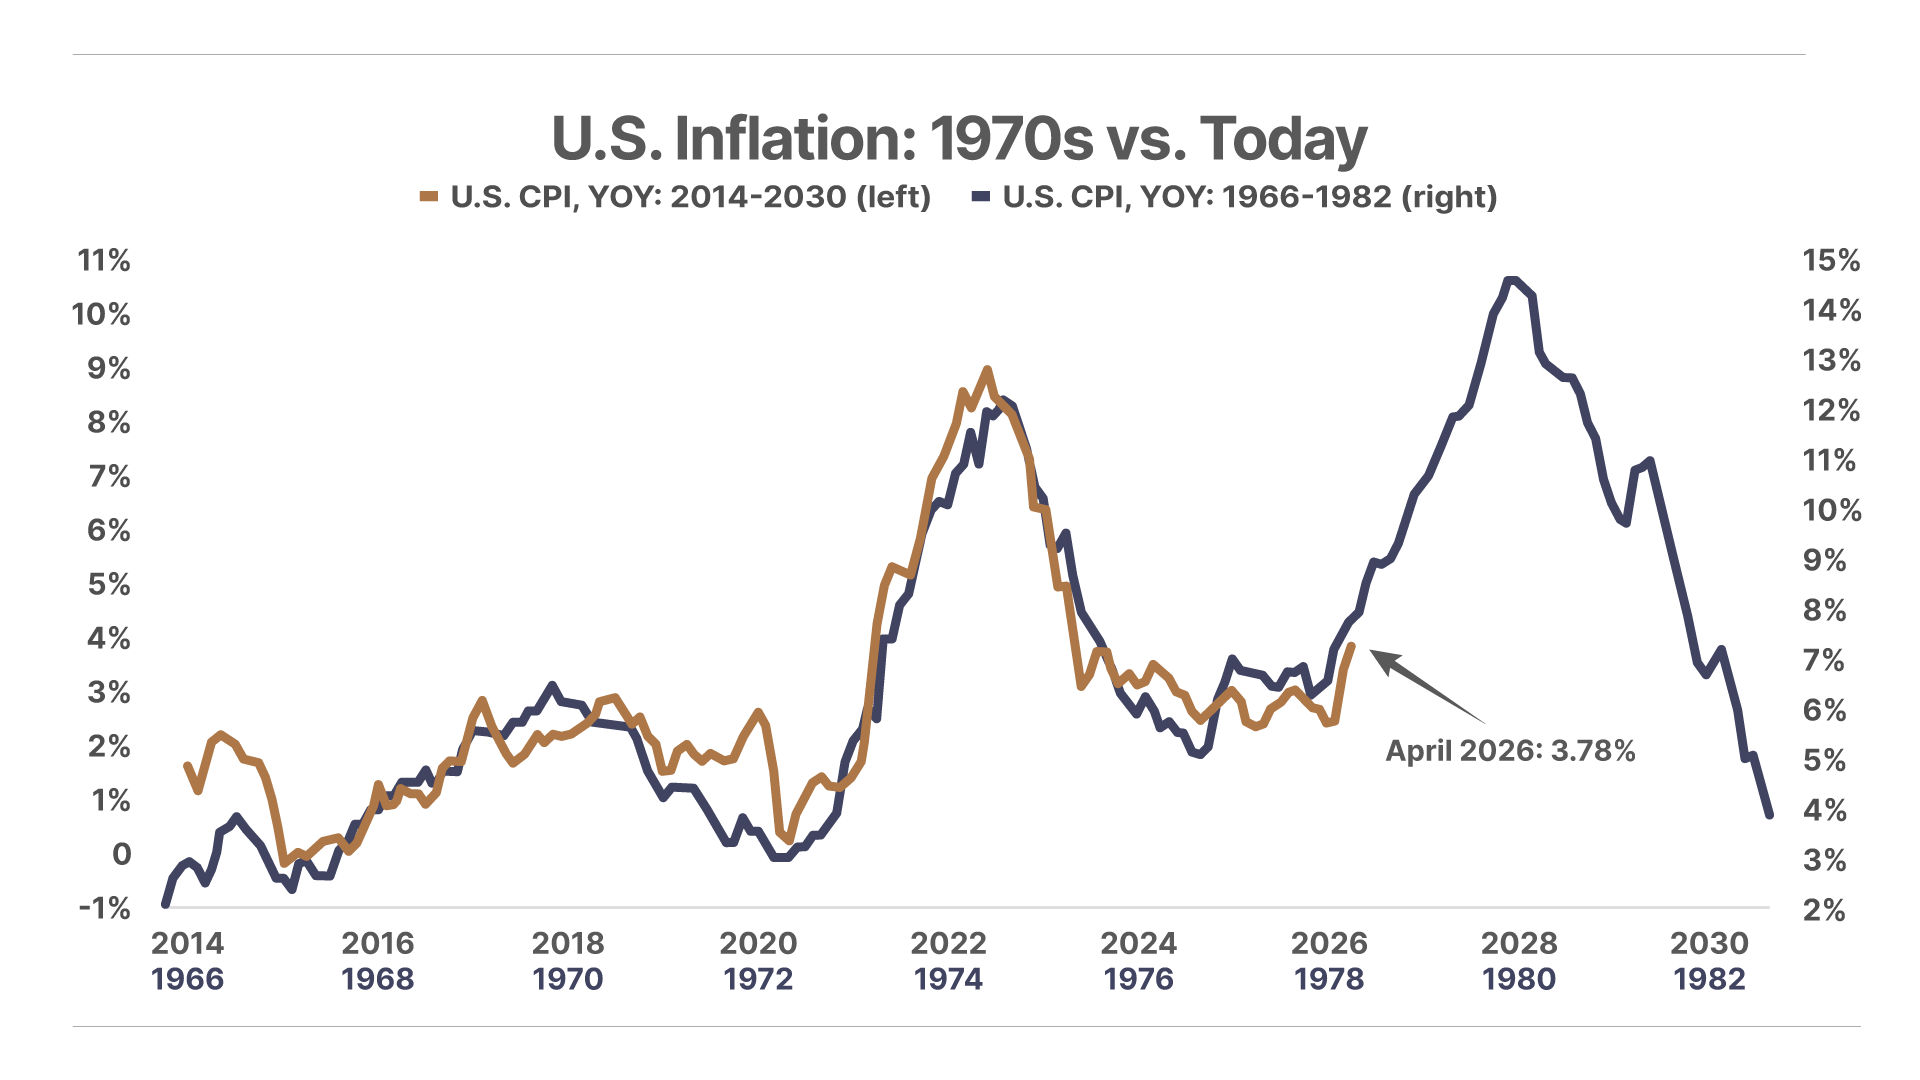
Meanwhile, Federal Reserve chair Arthur Burns succumbed to political pressure to keep interest rates below the rate of inflation ahead of the 1972 Presidential election. Rampant deficit spending and loose monetary conditions caused inflation to jump from 1% to 2% in the mid-1960s to over 6% by early 1973.
This all meant that the Fed was already behind the curve when the oil shock hit. It then spent the rest of the decade in a futile attempt to catch up with a runaway wage-price spiral, with inflation stuck above 5% into the early 1980s. The inflation wasn’t brought under control until Fed Chair Paul Volcker boosted interest rates to 18%, unleashing two back-to-back recessions in 1980 and 1982.
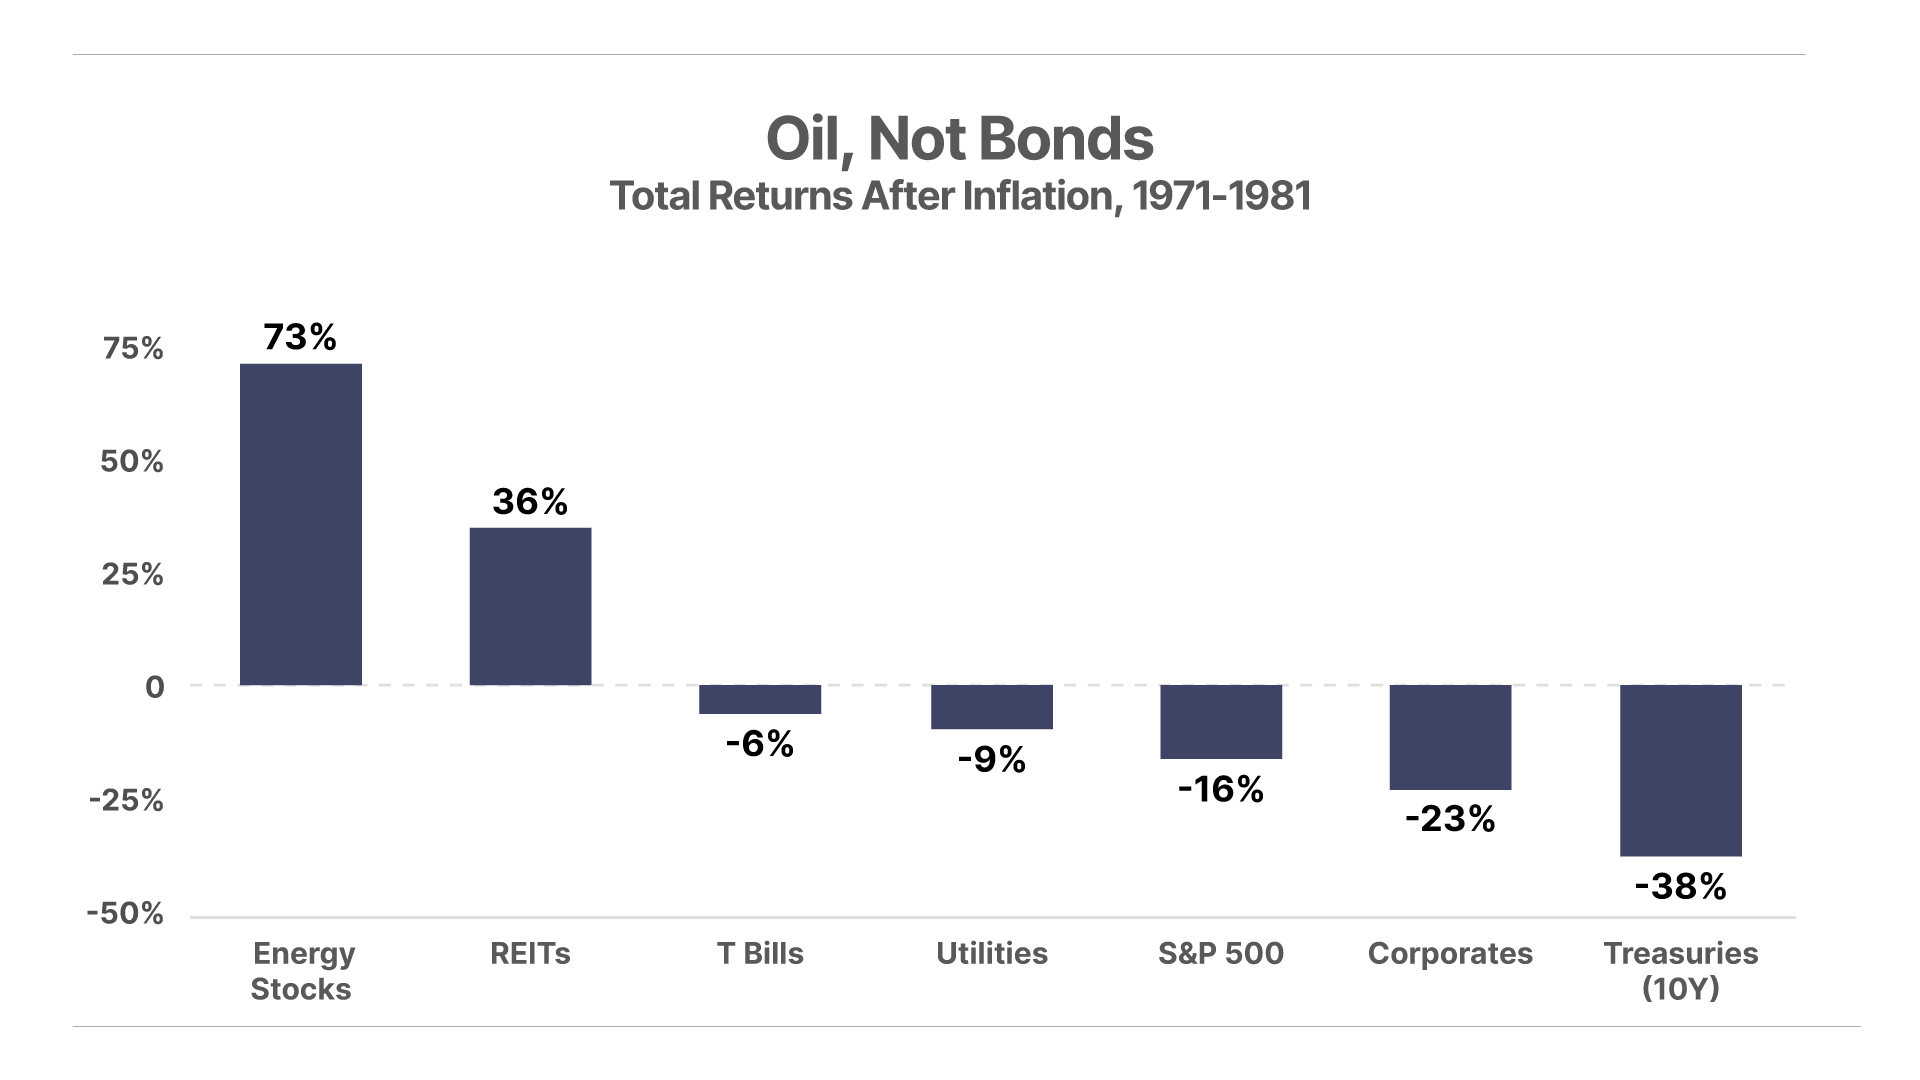
By then, the S&P 500 had lost two-thirds of its value in real terms over the course of a decade. Bonds also lost money in real terms, wreaking havoc on the traditional 60/40 portfolio. This represented the greatest loss of inflation-adjusted wealth for investors since the Great Depression.
Fast forward to today, and the U.S. economy finds itself in a similar situation.
The combination of record government deficits and the hangover from the COVID-era monetary explosion has kept inflation running above the Fed’s 2% target for each of the last five years.
Meanwhile, today’s oil shock comes at a time when President Trump is publicly lobbying the incoming Fed Chair Kevin Warsh to keep interest rates low even with resurgent inflation. Against this backdrop, it’s easy to see a scenario where inflation in the second half of the 2020s decade mirrors the path of the late 1970s:
If history repeats, the stage is set for a lost decade of returns in the overall stock and bond markets, while energy and other commodities like gold act as the ultimate inflation-proof source of real returns:
How To Hedge Stagflation
Given the risk of a replay of the 1970s, we view commodities-related stocks as a key source of inflation-protection in today’s market.
In The Trading Club, of which I am lead analyst, we show subscribers how to take advantage of the options market to unlock an extra stream of steady income from their commodities positions.
Consider a recent example in shares of WaterBridge Infrastructure (WBI), one of our favorite ways to play the West Texas oil boom. The company processes produced water generated by oil and gas wells, which is quickly becoming one of the most in-demand service needs in the Permian Basin – America’s most productive oil basin spanning across West Texas and New Mexico.
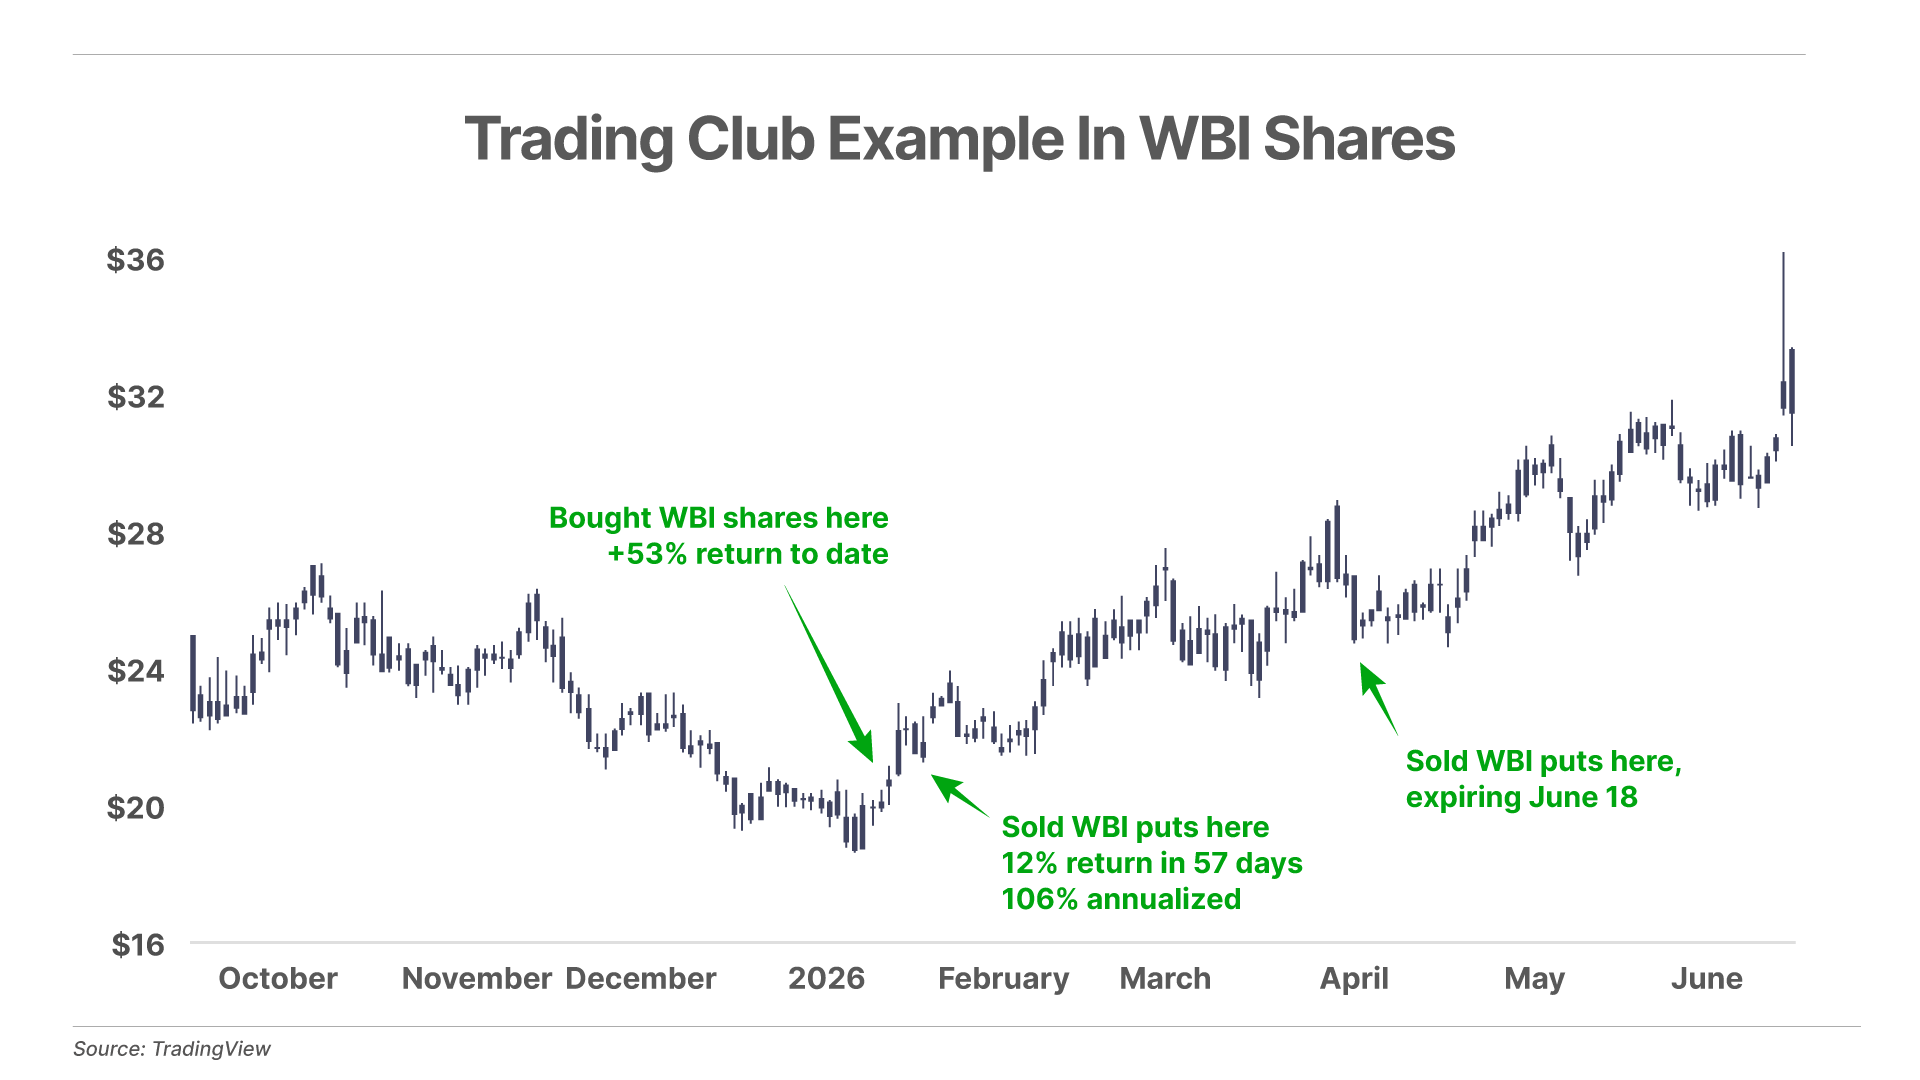
We initially bought WBI shares on January 14 at around $21, and have enjoyed gains of 54% to date. But along the way, we’ve also sold put options on the shares and generated a steady stream of double-digit yields.
By selling put options, we’re promising to buy shares at an agreed-upon price in the future from other investors seeking to hedge their downside risk. The put buyers have the option to sell their shares to us in the event that the stock price declines. Thus, put options act as a form of insurance for stock prices. In exchange for providing this insurance as the option seller, we collect upfront cash payments known as premiums.
We view these kinds of trades as the ultimate win-win scenario. If the share price keeps rising, the option value eventually erodes to zero and the insurance policy expires worthless – but we keep the premiums. If the share price falls, we end up buying shares of a stock we want to own, at a discounted future price.
To give you an idea of the kinds of returns available, consider the trades we’ve made so far in our real-money tracking account in The Trading Club.
On January 22, we sold three of the $25 strike WBI puts expiring on March 20. This meant we were committed to buying 300 shares of WBI if the price closed below $25 on March 20, representing a $7,500 capital commitment. In exchange, we collected $3 per share of upfront premiums, or $897.98 after trading fees.
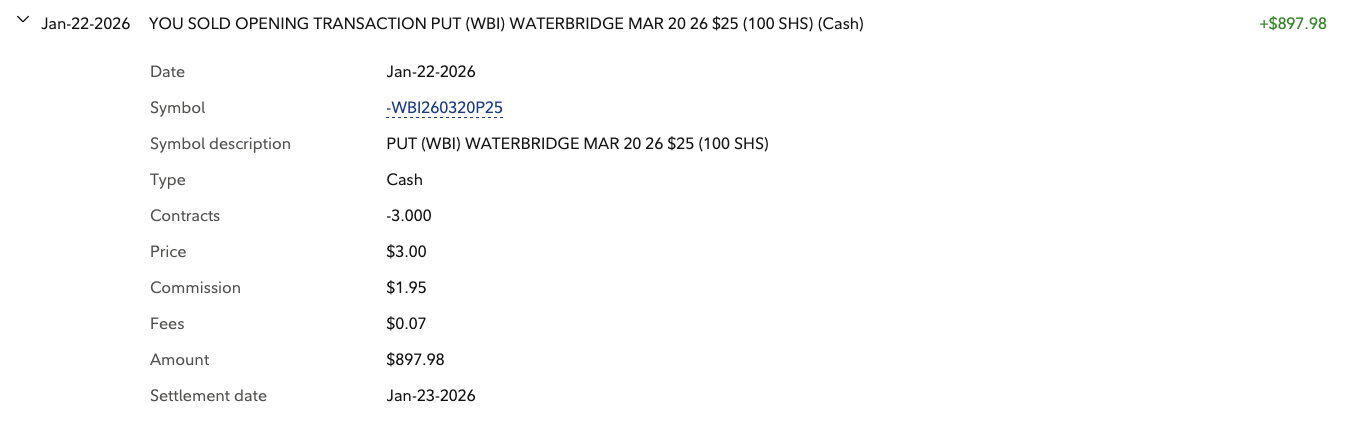
It turned out, the share price traded well above $25 on the March 20 expiration date. We kept the upfront premiums from the trade, and our obligation to purchase the shares expired along with the option contract. Thus we earned $897.98 in income on $7,500 of invested capital, or a 12% return. Since the trade occurred over just 54 days, that works out to an annualized return of 106%.
We then repeated a similar put sale on March 31, selling two of the $30 strike puts expiring this Thursday, June 18. We collected $832.65 in premiums in exchange for committing to purchasing 200 shares at $30 if the shares close below $30 on the expiration date.
With the shares trading well above the $30 strike price, these options are likely to expire worthless this Thursday, and as of the current price we’re sitting on a 95% gain.
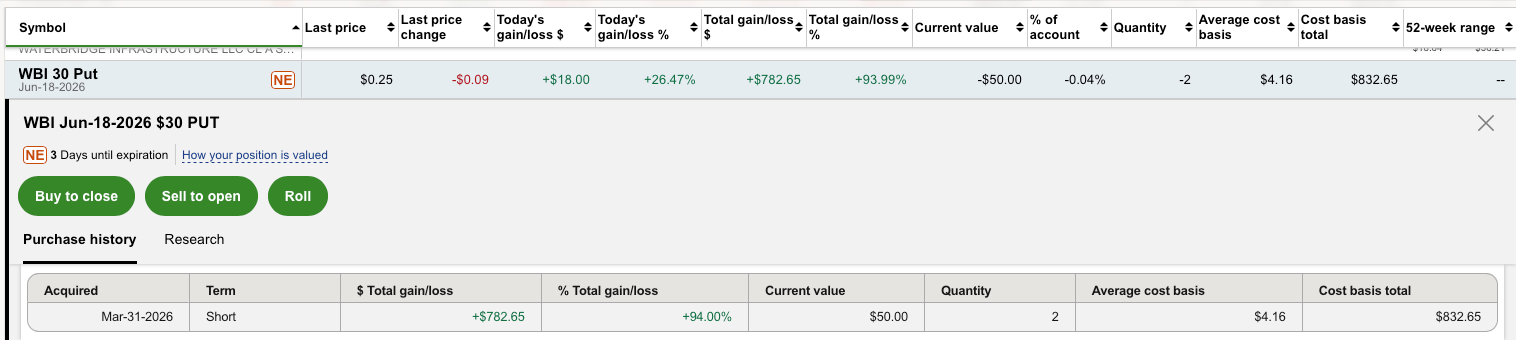
In the event that these options expire worthless, we’ll earn $832.65 on a $6,000 capital commitment, or a 14% return over 79 days. That works out to an annualized return of 82%.
Conversely, if the shares close below $30 this Thursday, we’ll be on the hook to buy 200 shares at the $30 strike price. But after netting out the $4.16 per share in premiums collected, our effective cost basis will be $25.83, or a discount of more than 20% to the current share price.
That’s the ultimate win-win scenario: either earn a triple-digit annualized return on the premiums, or end up buying shares at a substantial discount to the current trading price.
These types of option-selling trades make up the bread and butter of our investing approach in The Trading Club. We aren’t trying to time the market by buying low and selling high. We’re identifying world-class businesses we want to own for the long run, and systematically using the options market to either add shares at attractive prices, or generate steady income that compounds at highly attractive rates, as you can see in our WBI trade examples:
In today’s high-risk market, we view this as the ultimate balance between offense and defense. By steadily selling options around a core portfolio of long positions, we’re giving ourselves the opportunity to either add shares at a margin-of-safety price or consistently bring extra cash into the portfolio.
We also add other strategies into the mix, like buying selective put options to hedge against the risk of a market crash, providing us with insurance for limiting downside. We also occasionally identify asymmetric opportunities to buy call options for outsized returns, like our British American Tobacco (BTI) calls that have returned 362% to date.
Most importantly, we show you every step along the way, with a real-world track record where we place each trade in a live account. We don’t just aim to give you trades to follow, but to show you the reasoning and process behind each idea and how to express it in the options market. That way, you can learn how to add these tools into your own investing approach.
If this sounds like something you could use in your investing process, keep an eye on your inbox for a special invitation to become a new member of The Trading Club.
Tell us what you think of today’s Journal: porterstansberrydirect@gmail.com
Good investing,
Ross Hendricks
Houston, Texas
3 Things To Know Before We Go…
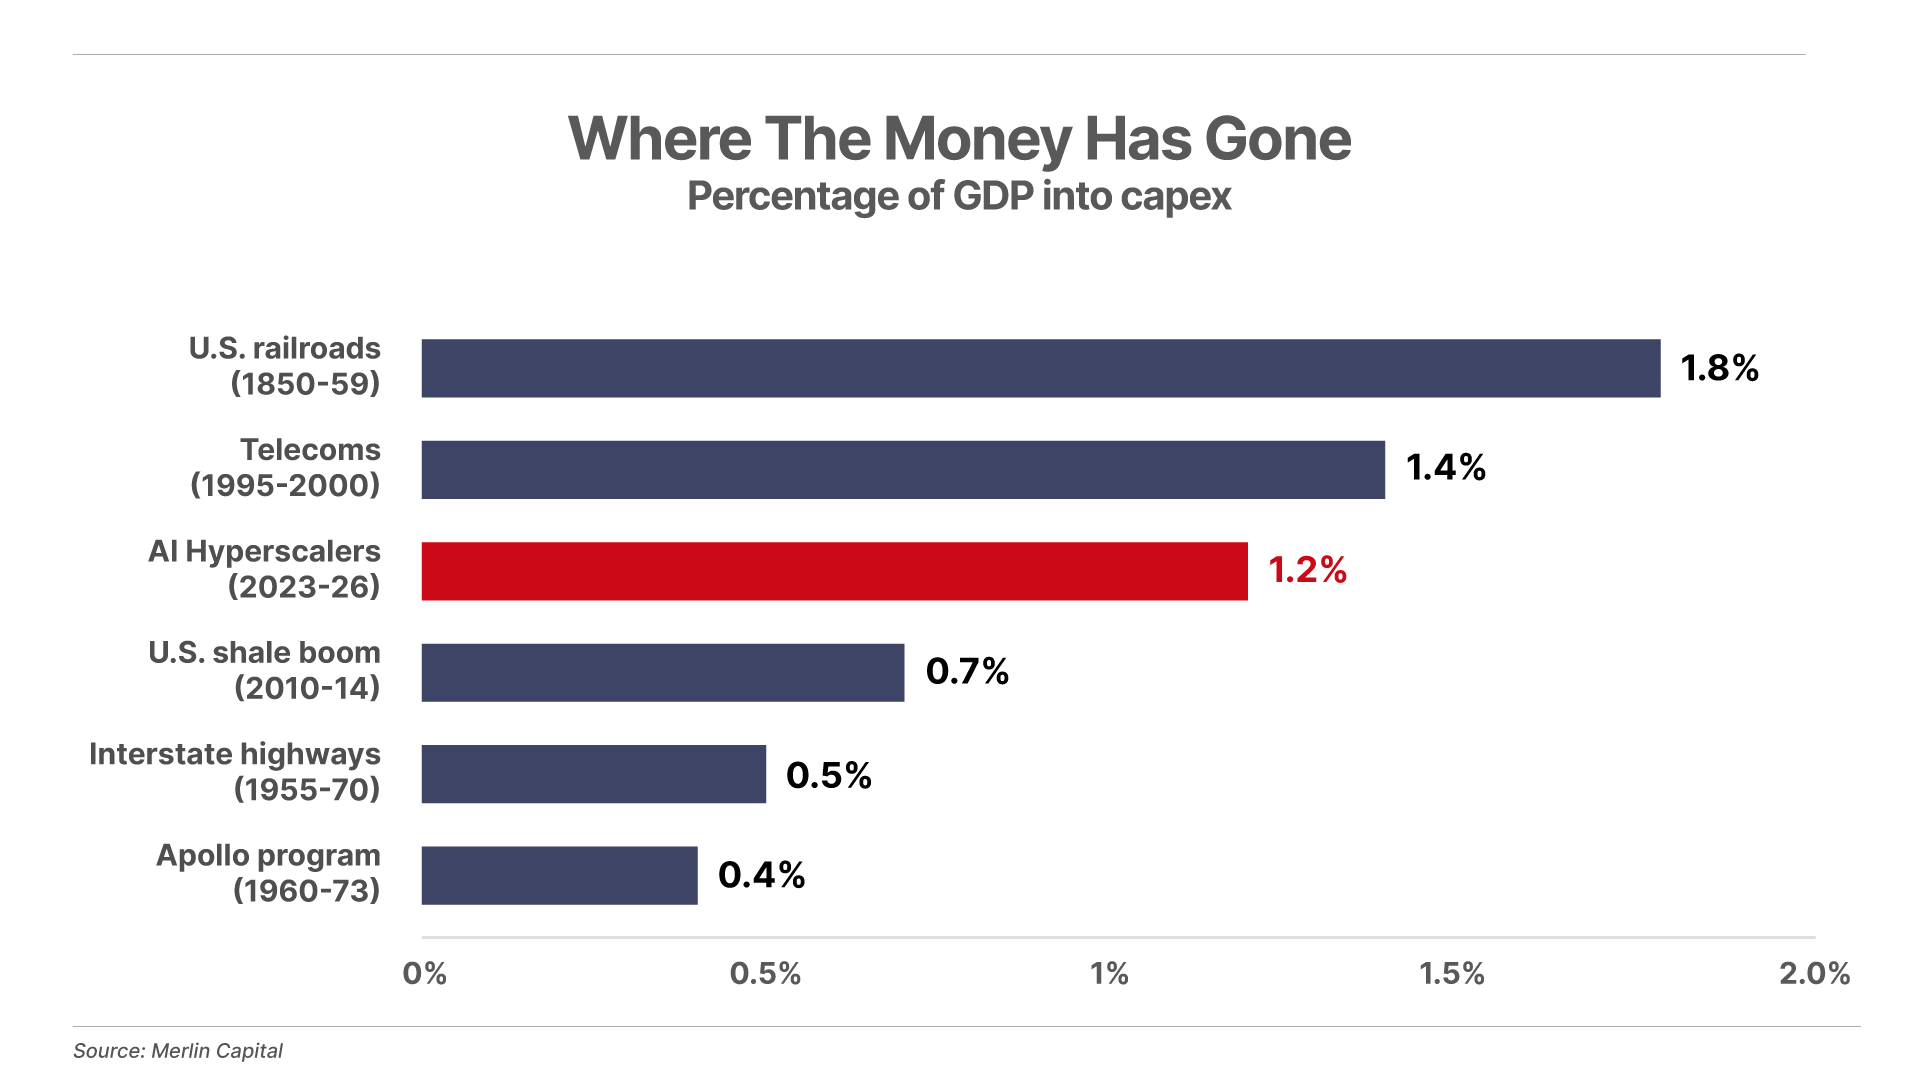
1. The AI spending boom (already) ranks among the largest investment surges in U.S. history. Averaged across 2023-2026, the four biggest hyperscalers – Amazon (AMZN), Alphabet (GOOG), Meta Platforms (META), and Microsoft (MSFT) – have put 1.2% of gross domestic product (“GDP”) into capital spending, just under the late-1990s telecom boom (1.4%) and within reach of the 1850s railroad mania (1.8%). And it's still climbing: 2026 hyperscaler guidance of $725 billion equals about 2.2% of GDP in a single year, and Goldman Sachs sees the four spending $5.3 trillion through 2030 – a pace that would rank this among the largest sustained investment waves the country has ever seen.
2. Wall Street has given up on a gold rebound. In the options market – where traders place bets on which way a price will move – positions that gold will rise have become the cheapest they've been in nine years, a sign that almost no one thinks gold will recover. In fact, traders are loading up on protection against a further decline in the price of gold. The moves follow the metal's 25% collapse from February's record high to around $4,100 an ounce.
3. A record 6% of Vanguard 401(k) participants took a hardship withdrawal in 2025. The withdrawal rate is up from 4.8% in 2024 and triple the 2% pre-pandemic rate, the sixth straight annual increase. The top reasons for withdrawals: avoiding foreclosure or eviction and covering medical bills. This happened even as the average 401(k) balance hit an all-time high of $167,970 (+13% on the year). The pattern points to a consumer whose paycheck can’t keep up with rising costs.
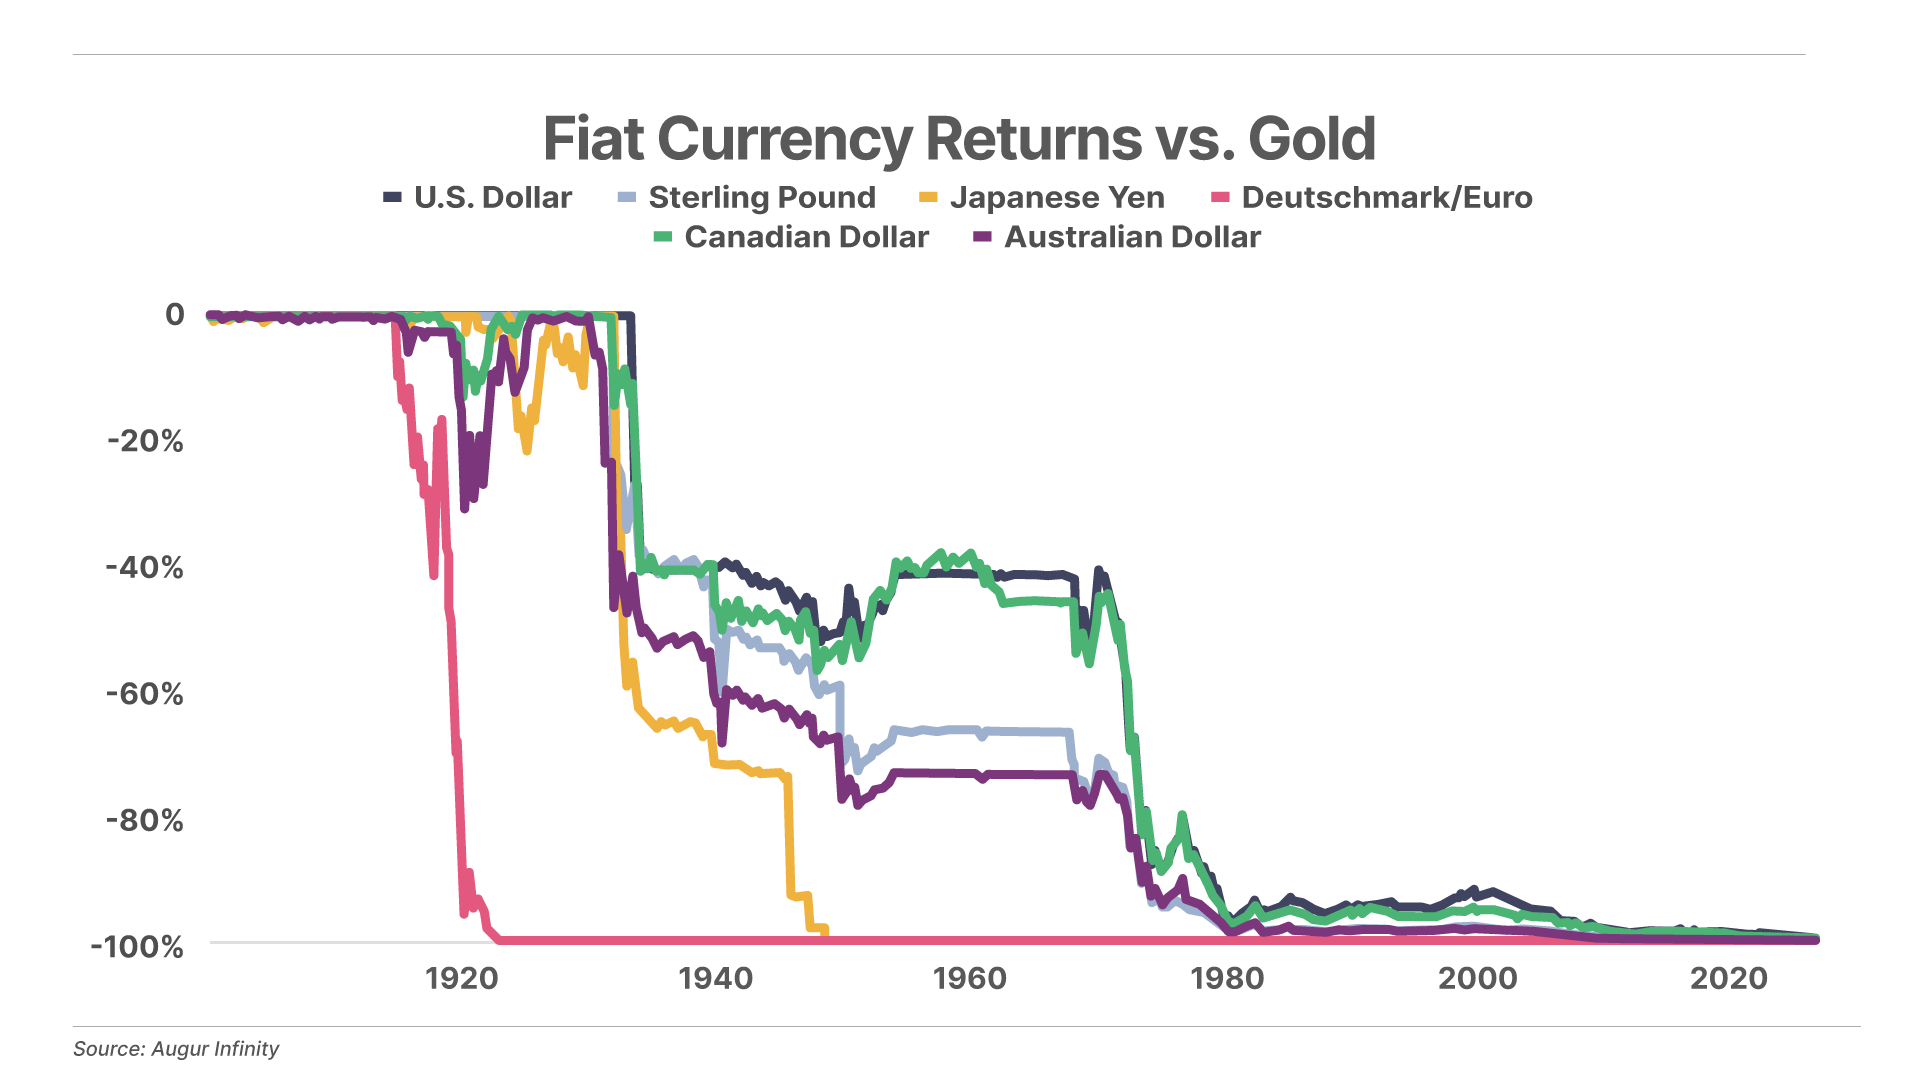
Chart Of The Day… Gold Versus Currencies
Over the past 125 years, all major global currencies have lost nearly 100% of their value relative to gold.
Poll Results… The $20,000 Option
On Friday we asked Daily Journal readers the following: If they were given $20,000 but had only five options for where to “invest” that money, which option would they choose? It seems we have investors over spenders as survey takers…
-
62% chose the gold-coins option
-
29% selected shares of The Hershey Company (HSY)
-
7% would buy shares of SpaceX (SPCX)
-
3% would spend the $20,000 on a year’s worth of groceries
-
0% (3 votes) would have bought one ticket to watch the NY Knicks play in the NBA Finals at Madison Garden
Mailbag
In Friday’s Daily Journal, Shannon Stansberry wrote about the risks of U.S. Sen. Elizabeth Warren’s taxes on data center energy consumption and AI billionaires. Readers share their thoughts…
“Elizabeth Warren Wants To Tax The Future”
Kathleen M. writes:
I disagree with her completely. I think the baby is already taking some of her brain cells. I figure you are between the ages of 35 and 40 since you got pregnant or maybe you used artificial insemination. And you're working as an analyst now – where were you before?
Are you going to let one of these data centers on your farm? This way you can
endure all the noise, high water bills, and electricity costs.
This is not a myth – talk to the people who are living with this huge disruption now.
They can't sell their homes because of it.
Work to bring back Obamacare – then you would be doing something for the
good of many Americans.
Have a smooth delivery.
Porter Comment: Kathleen – Many thanks for your note.
Before working at Porter & Co, Shannon was a consulting engineer at WSP, a global engineering firm headquartered in Montreal, Canada. She has also modeled for brands like Dior Beauty, Volkswagen, and Graco. Our private family matters aren't an appropriate topic for our company’s e-letter mailbag, but I am happy to address your other questions.
We can’t develop our farm, for either residential use or commercial use. The family who owned the farm before we bought it placed the property in the Maryland Environmental Trust. If that weren’t the case and I believed that an appropriately sized data center would produce a substantial return on my capital, I would happily build one if zoning laws permitted such development. We believe in utilizing our property to best serve our family’s interests.
We do not believe in the concept of the “common good.” There are many competing interests in America. What’s good for you may not be good for me and vice versa. But through competition and property rights, the market will allocate scarce resources most efficiently, producing the greatest good for the greatest many. These ideas have been thoroughly explained for centuries (see Adam Smith’s invisible hand and Hayek’s spontaneous order) and have been tested dozens of times in different countries and in different eras. The free market is undefeated.
It is sad and troubling that these very basic economic ideas are not universally understood.
The kind of top-down economic order that you seem to be advocating leads to poverty and failure. Not sometimes. Every. Single. Time. But that doesn’t stop politicians from promising you something for nothing, does it?
Take Obamacare (Affordable Care Act or ACA), which you seem to believe was a good idea.
ACA coverage expansions have cost taxpayers over $1.5 trillion from 2014-2024. On top of those costs, health insurance premium increases have averaged 50% since the introduction of ACA. And ACA’s deductibles have increased 35% since inception. These additional costs add up to about $15,000 per U.S. household.
We’re all paying vastly more for healthcare and the system is so badly managed that it could easily bankrupt our entire federal government.
Why didn’t Obamacare work? Well, it just so happens I know a little about insurance…
Insurance works via risk pooling and actuarial pricing – spreading costs across a group while charging premiums aligned with expected claims (risk-rated). This second part is very important. Think about car insurance. You can’t charge a 16-year-old male driver the same rate you’re charging a 50-year old female. They are worlds apart in terms of expected claims.
Pre-ACA, insurers used medical underwriting: they could deny coverage, charge higher premiums, or impose waiting periods/exclusions for pre-existing conditions based on health history, age, etc. This prevented adverse selection – where sicker people disproportionately buy/enroll (knowing they'll use more services) while healthier ones opt out or wait, skewing the risk pool toward high-cost claimants. This drives up premiums for everyone in the pool. Fair pricing requires aligning premiums with risk to sustain voluntary markets; ignoring it leads to vastly higher overall expenses.
Pre-ACA approaches allowed broader access for healthy/low-risk people at lower prices while managing high-risk cases differently (e.g., high-risk pools in some states).
Bottom line: There’s no way the government can efficiently distribute healthcare. Sorry about that. The Constitution doesn’t say you have the right to healthcare for a very good reason. The best way to distribute healthcare is the same way we distribute other scarce resources: via a market, with prices.
Thanks again for your note.
Regards,
Porter
“Warren AI Tax”
David H. writes:
Hello Shannon,
Your article on Elizabeth Warren’s AI tax proposal is excellent and insightful, and a major red flag warning for just how dangerous and misguided her proposal is.
I’m hoping your analysis will be printed, distributed, and read in the halls of Congress as the AI-taxation sharks are circling to attack and kill our USA AI economy.
Thank you for your insights and the work you and Porter are doing to keep all of us informed on these critical economic issues.
“Shannon’s Editorial”
Kevin B. writes:
Short and pithy.
Senator Warren was educated by the same system that taught people that you have to tax the productive to keep the freeloaders under your control. And that system created more freeloaders than it did productive people. The rubble is visible all over the planet: Cuba, Venezuela, Chad, and Madagascar. There are other examples, but these are among the worst. Her plan would import it to America as fast as the productive people will leave.
Porter & Co. Market Snapshot
| Price | Friday's Return | Year-to-Date Return | |
|---|---|---|---|
| S&P 500 Index | $7,431.46 | 0.50% | 9.1% |
| Gold per ounce | $4,219.33 | 0.17% | 0.5% |
| Bitcoin | $63,972 | -0.42% | -24.5% |
| Oil (West Texas Intermediate) per barrel | $84.88 | -2.03% | 40.0% |
| Berkshire Hathaway (BRK) | $732,100.00 | 0.76% | -3.0% |
| Porter's Permanent Portfolio | - | 0.25% | -2.2% |
| The Better Than Berkshire Index | - | 0.32% | 3.7% |
| Total Return | Annual Return | ||
| Porter & Co's Top Ranked* | 31.5% | 13.3% | |
| Yield | Friday's Change | Change Year-to-Date |
|
| U.S Treasury 30-Year Yield | 4.97% | 1 bps | 12 bps |
*A Complete Investor risk rating of 1 is defined as a "low risk, high allocation" security, while positions rated closer to a 5 are higher risk. Porter & Co.'s top-ranked positions include those rated either 1 or 2 in Complete Investor portfolio.
Porter & Co. Top Positions
| Publication | Ticker | Description | Total Return |
|---|---|---|---|
| Complete Investor | BWXT | BWX Technologies | 239% |
| Tech Frontiers | QURE | uniQure | 237% |
| Complete Investor | ARM | ARM Holdings | 175% |
| Complete Investor | BTC/USD | Bitcoin | 143% |
| Tech Frontiers | TGTX | TG Therapeutics | 140% |
| Tech Frontiers | ROIV | Roivant Sciences | 133% |
| Tech Frontiers | QURE | uniQure | 131% |
| Complete Investor | PM | Philip Morris | 128% |
| Tech Frontiers | SGMT | Sagimet Biosciences | 120% |
| Complete Investor | SKWD | Skyward Specialty Insurance | 103% |
Prices as of 4:00 pm ET June 12, 2026
Please note: The investments in our “Porter & Co. Top Positions” should not be considered current recommendations. These positions are the best performers across our publications – and the securities listed may (or may not) be above the current buy-up-to price. To learn more, visit the current recommendations page of the relevant service, here. To gain access or to learn more about our current recommendations, call our Customer Care team at 888-610-8895 or internationally at +1 443-815-4447.