The Company Raised Prices, But It’s Still A Broken Business
Inside Today's Issue
On August 31, I showed you why Jeff Bezos shorted CoreWeave (CRWV).
Well, sort of.
In his 2004 letter to Amazon (AMZN) shareholders, Bezos described a hypothetical teleportation machine. It cost $160 million, lasted four years, and produced $100 million of revenue a year.
Here’s the key figure: Bezos’ machine only produced 62 cents of revenue for every dollar of equipment. Depreciation expenses (the machines wearing out) swamped revenue. So even though demand was endless and the accounting showed earnings, the business was hopeless. Discounted at Bezos's 12% cost of capital, every dollar invested lost five cents.
There is no growth rate at which it makes sense to invest initial or subsequent capital to operate a business with these economics.
This morning the Nasdaq was moving higher because the “AI trade” was rallying on the back of CoreWeave’s most recent quarterly results. CoreWeave was up 15% at the open.
What changed? Each dollar of CoreWeave's equipment is now producing 26 cents of revenue. That's a lot better than 22 cents per dollar of equipment (from last quarter's report), but it's still a dead end for investors. By our math (which assumes a 12% cost of capital), each dollar invested in CoreWeave now destroys 35 cents instead of the 46 cents we reported earlier. Either way, the intrinsic value of the business is still less than zero.
Nevertheless, the stock is rallying because revenue rose 168% from a year ago to $3.66 billion. Adjusted EBITDA – which ignores CoreWeave’s two largest expenses (interest and depreciation) – was $2.26 billion.
What changed? Prices went up.
The rental rates for Nvidia's (NVDA) older H100 chips had fallen about 70% in three years. CoreWeave raised prices across its products 25% in July and another 10% later in the quarter. Management says prices for its older Hopper and Ampere chips rose 30% to 50% from the second quarter, above their original contract prices.
CoreWeave says it is largely sold out through 2027.
Think about why. It’s selling compute at far below the full cost to provision it! So of course it’s sold out. And it probably will always be sold out, at current prices. But, remember:
There is no growth rate at which it makes sense to invest initial or subsequent capital to operate a business with these economics.
CoreWeave management expects to end December with revenue running at $20 billion to $21 billion a year. Let's assume it ends up at $20.5 billion. And let's assume CoreWeave never buys another chip. Each dollar of equipment would then produce 36 cents of revenue a year… and the company would still fail!
To break even at a 12% cost of capital over six years at its current margins, CoreWeave needs a minimum of 39 cents of revenue for every dollar of equipment. That's $22.3 billion a year from the equipment it already owns, 52% more than the 26 cents it produced last quarter.
And what’s CoreWeave’s actual cost of capital?
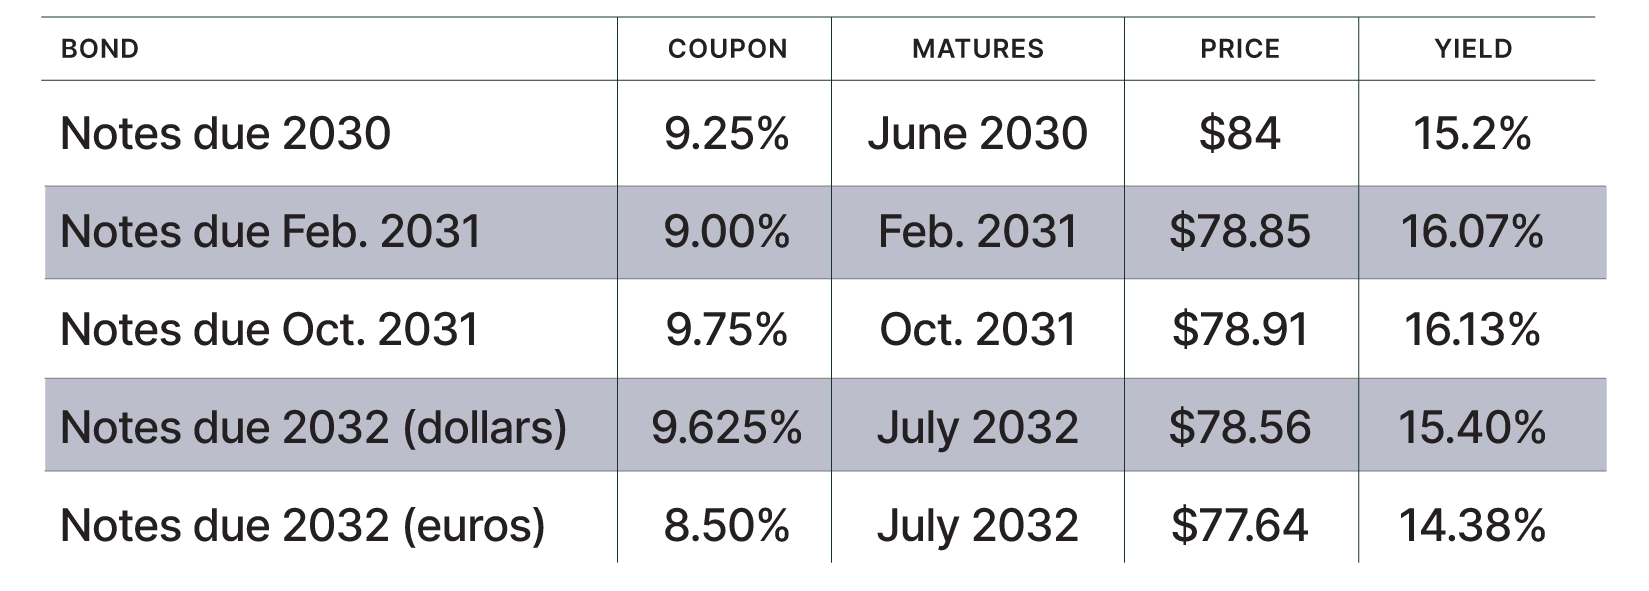
In August, we told you CoreWeave carried $35.07 billion of debt against $5.02 billion of equity: 7x leverage. Three months later, debt is $46.9 billion and equity has shrunk to $4.0 billion, which is almost 12x leverage. Add $19.3 billion of lease liabilities, and it's more than 16x. Interest expense last quarter was $846 million: 23 cents of every dollar CoreWeave billed. Here’s how the market is currently pricing CoreWeave’s debt (price is based on $100 par value). As you can see, the market is charging more than 12%.
And the cash? CoreWeave produced $1.98 billion of operating cash flow in the last quarter and spent $9.44 billion on property and equipment, so free cash flow was negative $7.47 billion.
Since 2023, CoreWeave has consumed $32.3 billion of cash against $15.6 billion of cumulative revenue. That's $2.07 consumed for every $1 billed.
Investors keep pointing to the backlog, which grew to $132.5 billion from the $104 billion we cited in August. But what does this backlog really mean? It means when you’re selling something valuable at a huge loss, there’s going to be a line around the block.
It doesn’t mean you have a great business.
Tell me what you think of today’s Daily Journal: porterstansberrydirect@gmail.com
Good investing,
F. Porter Stansberry
Stevenson, Maryland

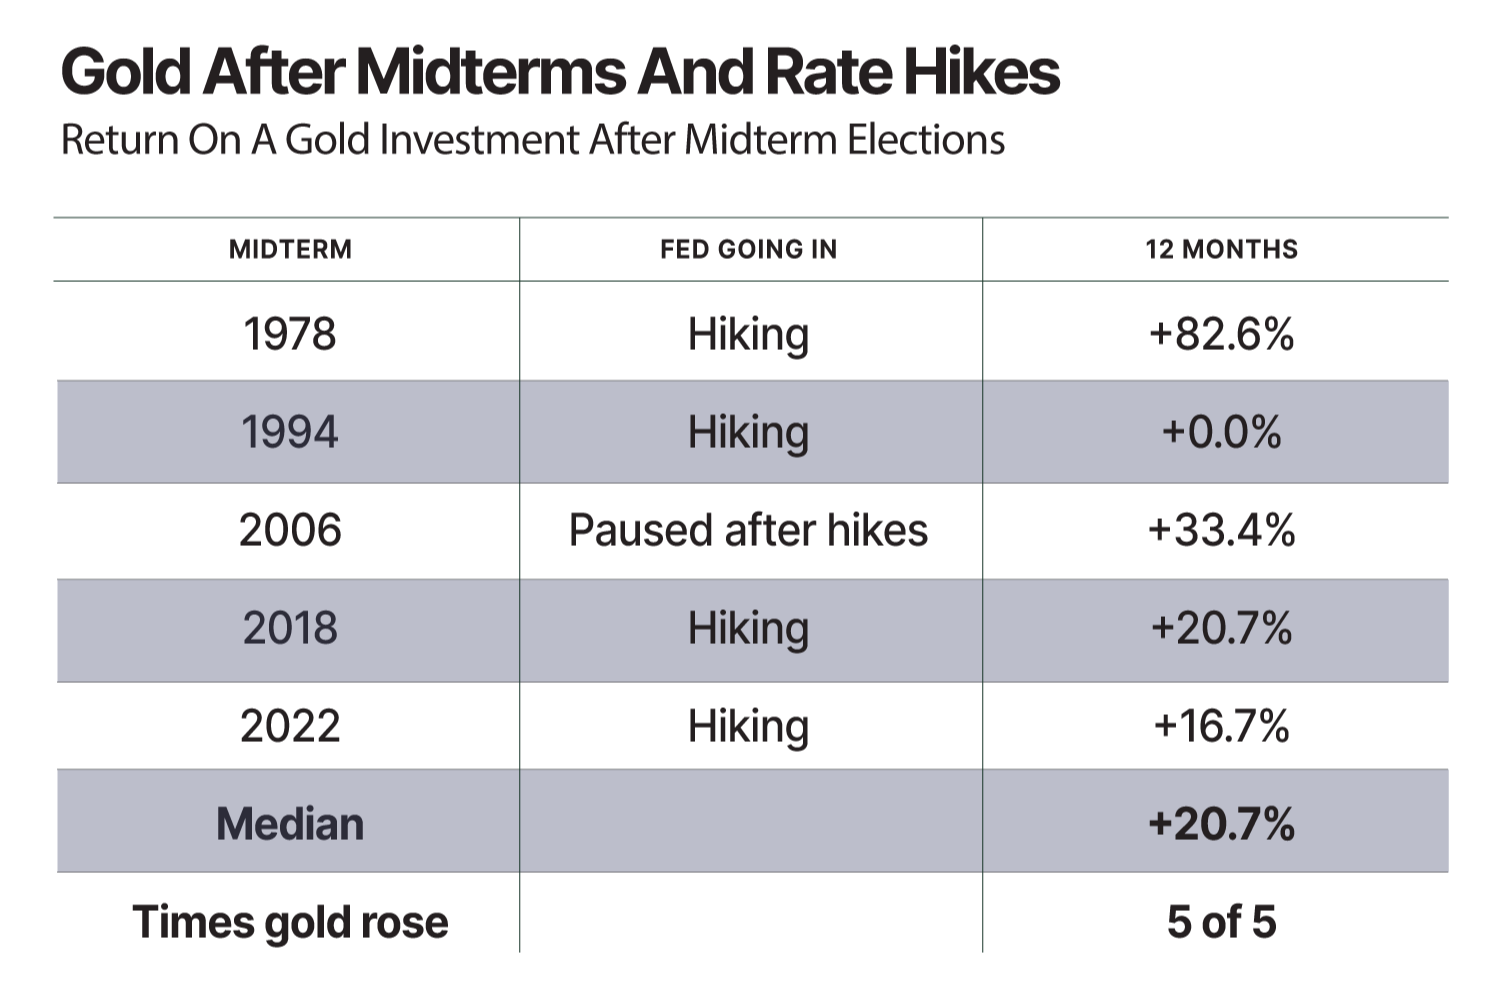
1. Great gold returns in the year after midterms and rate hikes. In the five off-year federal elections since 1978 when the Federal Reserve was raising rates or had just stopped, gold’s median 12-month gain was about 21%. It didn’t fall once. With the Fed cutting or on hold, the median was a 3% loss. This year looks most like 2006 so far: a September hike, then an October pause. Gold rose 33% in the year after that election. If the Fed hikes again in December, as futures suggest, 2018 and 2022 become closer matches. Gold gained 21% and 17% after those.
2. Stocks have done even better after midterms that leave Democrats running Congress. The S&P 500 has risen in the six months after every midterm since 1950, by 14.1% on average. In the 11 cases where Democrats held both the House and Senate afterward, the average gain was 16.5%, with no losses. But this time may be different. The last time Democrats flipped both chambers at once, in 2006, stocks gained just 9.2% over the next six months, and the 2007–2009 bear market began within a year. Past performance is no guarantee of future results.
3. OpenAI continues to suffer heavy losses. According to documents viewed by The Wall Street Journal, OpenAI’s Q3 revenue rose nearly 50% from Q2, to $10 billion. Its adjusted operating loss increased to $10.9 billion from $10.1 billion. That figure excludes $2.6 billion in stock-based compensation. Counting it, OpenAI lost about $13.5 billion, an operating margin of roughly negative 135%. Rival Anthropic, which counts stock comp as an expense, grew revenue 47% to $17 billion, with an operating loss of $567 million.
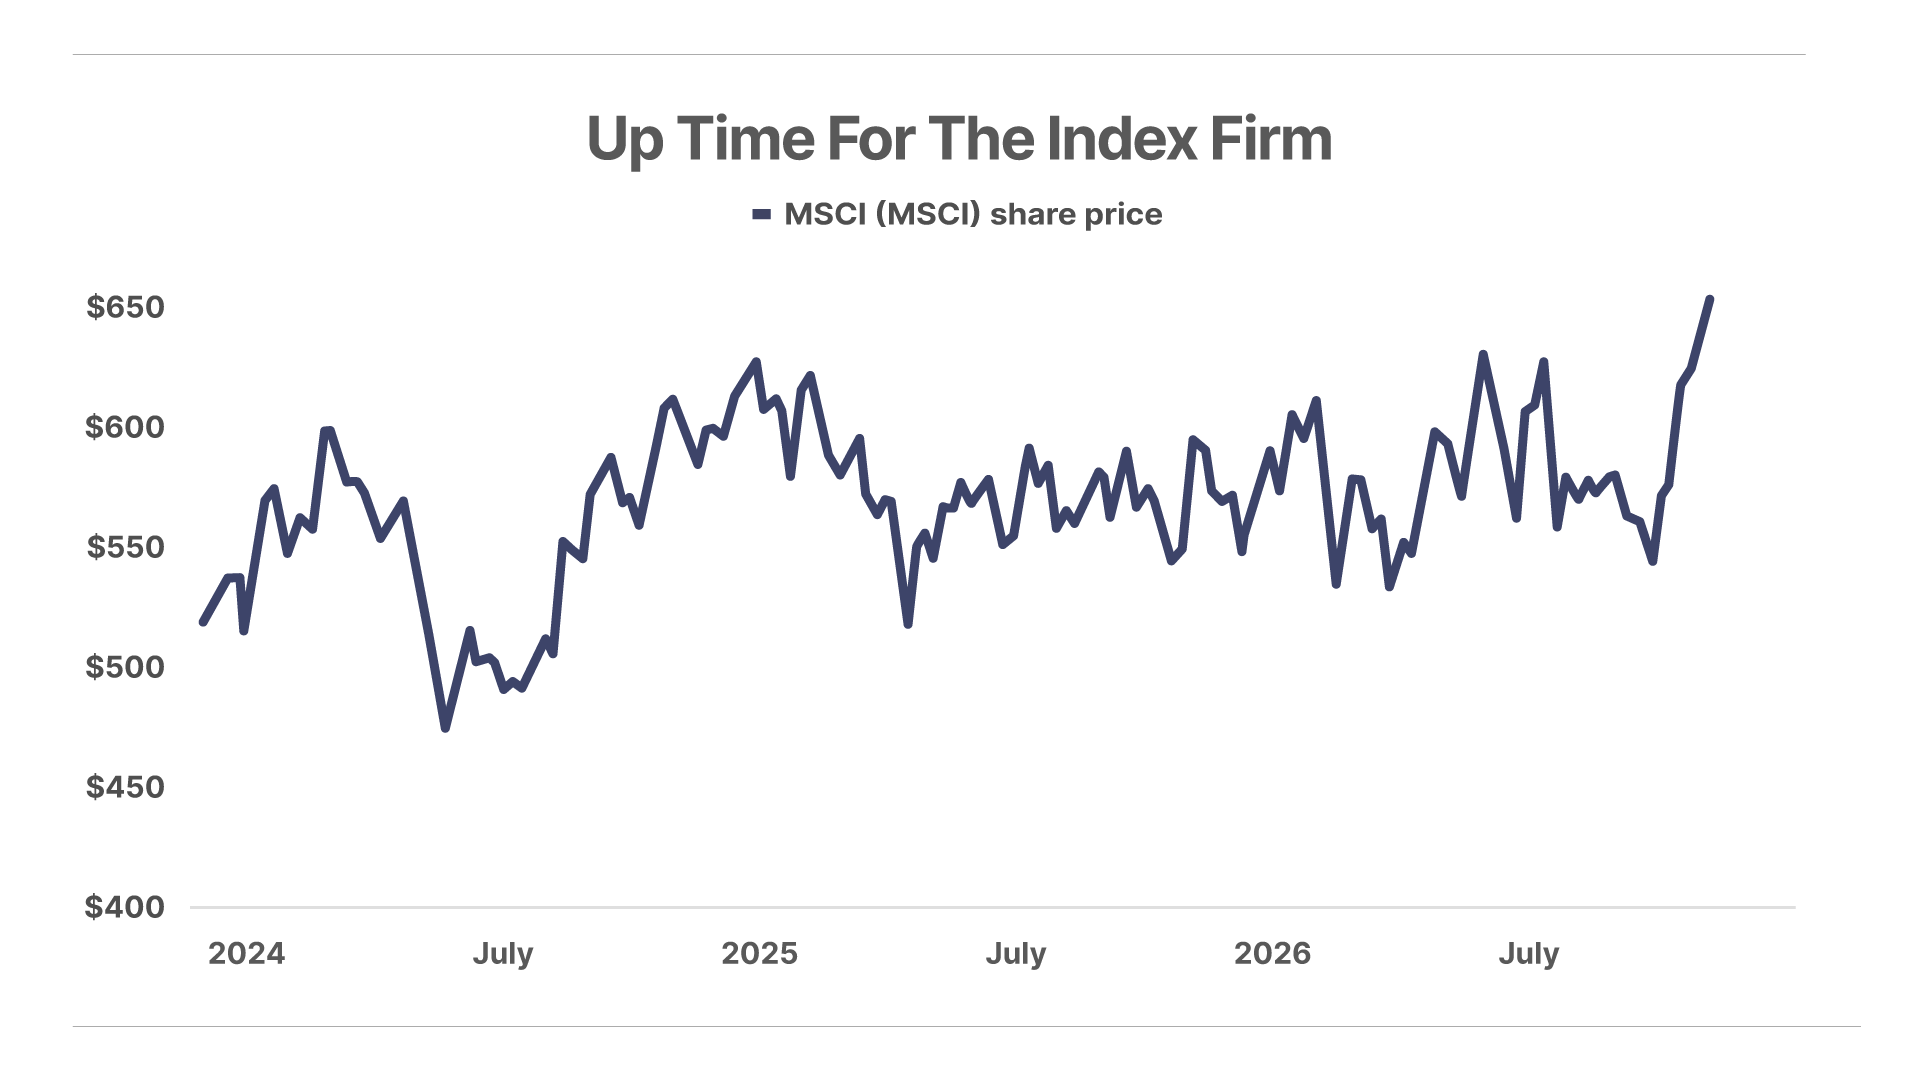
After selling off alongside other financial-data stocks earlier this year amid fears of AI disruption, shares of MSCI are trading at a four-year high following better-than-expected Q3 earnings last month. On the company’s Q3 call, CEO Henry Fernandez argued that AI agents could expand MSCI's user base from tens of thousands of users at client firms to hundreds of thousands and eventually millions. He called MSCI "a great franchise for the age of AI." The stock is up 12% since we recommended it to Complete Investor subscribers in January, and is now less than 3% from its previous all-time high set in 2021.
Yesterday, Systematic Crypto analyst Justin Brill reported on the performance of Bitcoin and other cryptocurrencies following hacks.
“Optimized Crypto ETF”
Thomas D. writes:
An optimized crypto ETF would be best, if it can be secured. The ETF for BTC is good, but we need one that includes other good coins, as per optimization by Juan Villaverde.
Check it out.
Larry H. writes:
Justin Brill reported that "No hack in Bitcoin's history has derailed a bull market"
All well and good unless you are the one who got hacked. I don't see how there would be any other safe way to invest other than your recommendation of through a broker and a Bitcoin ETF. Thanks for the advice.
“Weyerhaeuser”
Greg F. writes:
Porter, I agree with most of your views. But just a couple things...
1) You said you don't want a Social Security check… feel free to forward yours to me.
2) WY is down 36% since I bought it many years ago – in fact, it's down about 33% over the last decade. Not sure how that qualifies as a great investment idea.
Porter Comment:
1. I don’t want to participate in a Ponzi scheme that I know will harm my children
2. They own trees. Much like buying a bond, the trees grow at a known and constant rate. Thus your return is based, wholly, on the price you pay when you buy.
Regards,
Porter
Porter & Co. Market Snapshot |
Through Tuesday, November 10, 2026 close |
| Markets |
| Index or asset | Last | 1-Day | YTD | 1-Year |
|---|---|---|---|---|
|
S&P 500
Total return
|
749.92 | −0.37% | +10.8% | +11.2% |
|
Gold
Front-month futures
|
$4,030.20 | −2.05% | −7.2% | −2.2% |
|
Bitcoin
4 pm ET print
|
$73,671.00 | −1.48% | −15.8% | −30.4% |
|
Crude oil
WTI, per barrel
|
$86.04 | −0.93% | +49.8% | +43.1% |
|
Berkshire Hathaway
NYSE: BRK-A
|
$875,655.00 | +2.60% | +16.0% | +17.6% |
| U.S. Treasury yields |
| Maturity | Yield | 1-Day | YTD | 1-Year |
|---|---|---|---|---|
|
2-Year
|
4.73% | +17 bps | +126 bps | +115 bps |
|
10-Year
|
4.98% | +10 bps | +80 bps | +85 bps |
|
30-Year
|
5.35% | +9 bps | +51 bps | +64 bps |
| Porter & Co. strategies |
| Strategy | 1-Day | YTD | Since start | Per year |
|---|---|---|---|---|
|
Porter's Permanent Portfolio
Since September 25, 2024
|
+0.06% | +7.3% | +35.3% | +15.3% |
|
Better Than Berkshire Index
Since May 16, 2025
|
+0.38% | +4.0% | +4.3% | +2.9% |
|
Porter & Co. Top Ranked*
Since July 14, 2022
|
+0.04% | +4.2% | +29.3% | +9.8% |
Porter & Co. Top Positions |
Through Tuesday, November 10, 2026 close |
| # | Position | Total return |
|---|---|---|
| 1 |
Roivant Sciences ROIV
Biotechnology
|
+260% |
| 2 |
Roivant Sciences ROIV
Complete Investor
|
+256% |
| 3 |
TG Therapeutics TGTX
Biotechnology
|
+242% |
| 4 |
Bitcoin BTC/USD
Complete Investor
|
+173% |
| 5 |
Skyward Specialty Insurance SKWD
Complete Investor
|
+157% |
| 6 |
APA Corporation APA
Porter & Co. Asymmetry
|
+152% |
| 7 |
Philip Morris PM
Complete Investor
|
+143% |
| 8 |
W.R. Berkley WRB
Complete Investor
|
+125% |
| 9 |
BWX Technologies BWXT
Complete Investor
|
+124% |
| 10 |
Chubb CB
Complete Investor
|
+99% |