Issue#135, Volume#3


Big Tech’s Trillion-Dollar Infrastructure War
Inside Today’s Issue
Hoard cash and grow like hell.
For the better part of two decades, the dominant investment thesis for Big Tech was capital-light scalability. Companies like Microsoft (MSFT), Alphabet (GOOG), Meta (META), and Amazon (AMZN) built global empires on software, search algorithms, and social networks – high-margin digital products that required relatively little physical infrastructure to reach the next billion users.
However, the dawn of artificial intelligence (“AI”) has forced a violent restructuring of this business model. Today, these hyperscalers, as they’ve been dubbed, are no longer just software companies – they have transformed into the most aggressive industrial builders in human history.
The shift is defined by a staggering explosion in capex directed toward the physical infrastructure of AI: massive data center campuses, specialized semiconductor clusters, and the energy infrastructure required to power them. This pivot has moved Big Tech from a state of overflowing free cash flow to a regime of capital intensity that is beginning to strain even the largest balance sheets in the world.
The Unprecedented Scale Of Investment
The scale of the current AI buildout is difficult to overstate. It has officially become the largest capital investment cycle in American history, surpassing the telecom and fiber boom of the 1990s. Since 2022, the four primary American hyperscalers – Microsoft, Alphabet, Amazon, and Meta – have committed over $1 trillion in cumulative capital expenditure. By 2030, this figure is projected to exceed $3 trillion – as a reminder, $1 trillion is one thousand billion.
In 2026 alone, these four companies are expected to sink $750 billion into capex, a figure that equals the entire annual GDP of Ireland. This represents a 10-fold increase in their capex budgets compared to just one decade ago. Projections for 2027 suggest this spending will accelerate further, reaching an annualized run rate of $1 trillion.
To understand the individual commitments, one must look at the specific infrastructure roadmaps of these giants:
- Amazon: Historically the most aggressive spender, Amazon has invested approximately $200 billion in 20 new computer centers and the revamping of its existing AWS infrastructure. The company plans to double its total compute capacity by 2027 and spend a total of $400 billion by 2030.
- Microsoft: Driven by the success of integrating AI “Copilots” into its software suite, Microsoft has spent $100 billion over the last three years on 15 major new centers. Looking forward, it plans to invest another $300 billion by 2030, building more than 50 new data centers every year.
- Alphabet and Meta: Both companies have spent roughly $75 billion each on new infrastructure since the launch of ChatGPT. Each has signaled plans to spend an additional $300 billion through 2030.
The Death Of Capital-Light Margins
The most profound consequence of this “Parallel Processing Revolution” is the erosion of the tech sector’s historically pristine cash flow dynamics. Big Tech companies are now spending approximately 60% of their operating cash flow on capital expenditures. This is nearly double the average level of the past decade.
This massive cash drain is putting significant pressure on free cash flow (“FCF”) margins. While analysts expect double-digit earnings growth – averaging 29% year-over-year (“YOY”) for the hyperscalers – the actual cash left over after building data centers tells a different story. Hyperscaler FCF is expected to drop by an average of 31% YOY. This trend is forecasted to continue, with FCF for this cohort on track to drop by nearly 50% from its late-2024 peak through early 2026.
In the pre-AI era, hyperscaler earnings and FCF tracked alongside one another in a nearly perfect one-for-one relationship. As recently as 2022, the group generated around $250 billion in earnings and a similar amount of FCF. Since then, however, while reported earnings growth has set new highs, FCF has gone in the opposite direction – and at an accelerating rate. And for the first time ever, the group is on track to dip into negative FCF territory starting next year:
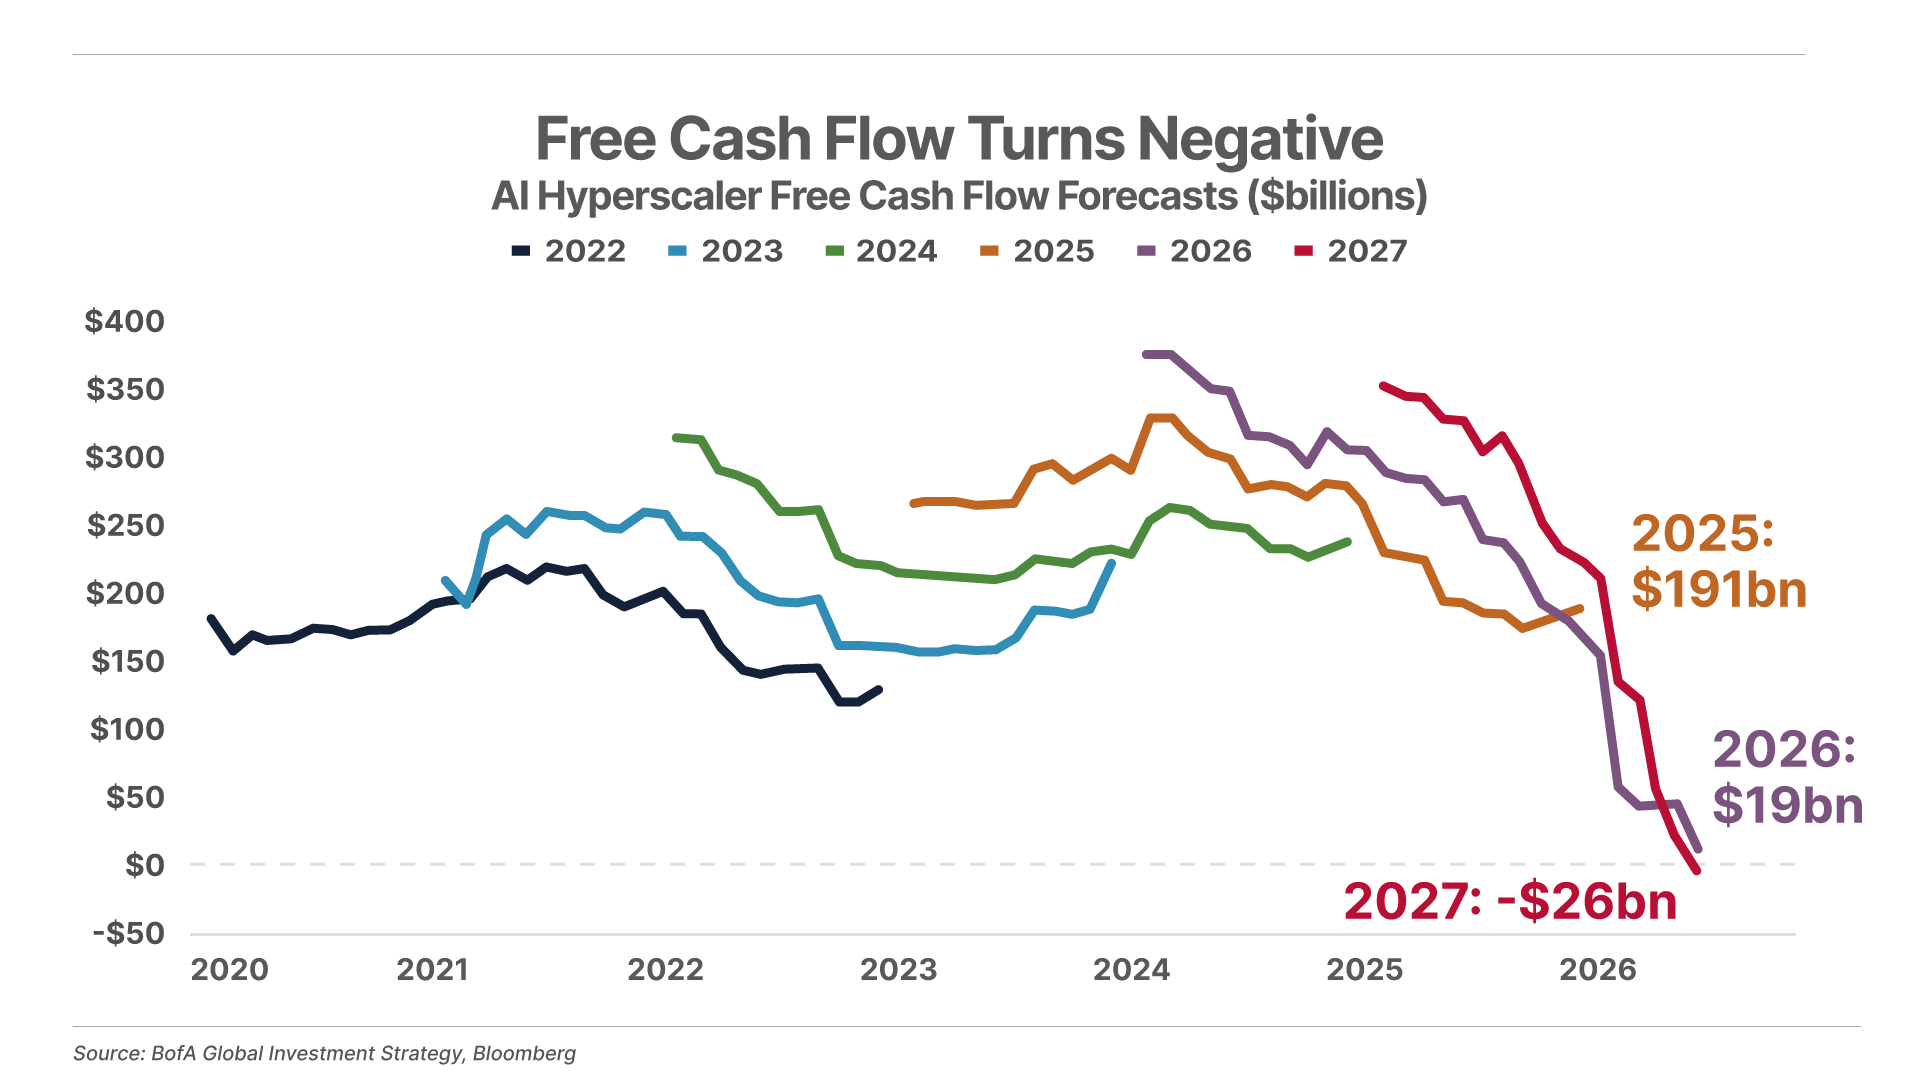
The dwindling cash flows from the hyperscalers have caused these companies to turn to the debt markets to fund the AI infrastructure build-out.
Alphabet, Amazon, Meta, Microsoft, and another player, Oracle, have collectively added roughly $350 billion in on-balance-sheet debt over the past five years. And recently, they’ve begun taking on even more liabilities that are being hidden from plain view on the books through off-balance-sheet financing arrangements – they’ve committed to $1.1 trillion in off-balance-sheet data center lease agreements, alongside supply deals for GPU processing chips, reaching an estimated $1.65 trillion in total hidden obligations.
This investment cycle is not merely a digital phenomenon. It is a massive demand shock to the physical world – it is fundamentally a massive physics problem that requires two things in almost incomprehensible quantities: compute and energy.
The AI Buildout Is Devouring The Electrical Grid
In 2026, American hyperscalers are projected to consume approximately 150 terawatt-hours (“TWh”) of electricity, representing 3.5% of total U.S. generation. By 2030, that consumption is projected to reach 500 TWh to 700 TWh – as much as 10% to 14% of the entire national grid. Some estimates suggest that by 2035, data centers could devour one-fifth of the U.S. grid. This has turned power generation into the next major AI bottleneck, as the U.S. is not building generation capacity fast enough to keep up with this curve.
The physical construction requirements are equally staggering. U.S. data center construction hit a record $40 billion annualized in mid-2025. Each hyperscaler facility requires between 50,000 and 100,000 tons of specialized, high-strength concrete. By 2030, data center demand for cement is expected to eclipse that of national highway systems, with data center concrete demand forecast to hit $112 billion annually.
The big question surrounding this capex binge is: Will this spending spree generate real returns for these companies? While $500 billion is flowing into AI infrastructure annually – helping the concrete mixers, chip makers, and wire layers – the companies laying out the cash are not yet generating the revenue needed to earn a return on that investment.
Total revenue across all AI applications is estimated to be around $150 billion this year, with economists estimating the need for $2.3 trillion in additional revenue just to break even on the total capex flowing into the industry. ChatGPT owner OpenAI generates an estimated $25 billion in annual recurring revenue – a fraction of the hundreds of billions being spent to build the machines its large language models run on.
Furthermore, corporate adoption remains mixed. Reports indicate that a significant number of companies adopting AI have yet to see meaningful results, with many scrapping initiatives because of the cost of adoption. Of course, it’s also giving many businesses a big boost in productivity – from software-subscription businesses to code writers to customer-service-heavy enterprises. And that corner of AI productivity is likely to be the secret winner over the next few years.
There is a big bright future out there in AI, and even if we don’t know precisely what it looks like and how we can capitalize on it, we need to build the road to get there. And that road costs trillions of dollars to unroll.
For investors, this massive AI buildout has created new opportunities – and risks (just ask Leopold Aschenbrenner).
We at Porter & Co. began writing about the AI buildout more than two years ago with our Parallel Processing Revolution report to provide investors the lay of the land. And for Complete Investor subscribers, we have recommended the players benefiting in various ways – the energy providers, the infrastructure builders, the chip makers, and the one hyperscaler we feel is poised to profit the most. And of the four hyperscalers mentioned here today, this one hyperscaler is up 80% over the last 12 months, while the others are down 23%, down 4%, and up 23%. And even though it’s up 54% since our recommendation and currently a “hold,” we can’t give away the name, but we can offer a hint… it rhymes with bugle.
Tell us what you think of today’s Daily Journal: porterstansberrydirect@gmail.com
Geoffrey Morris
Ridgefield, Connecticut
P.S. For 50 years, market predictions offered up at The New Orleans Investment Conference have become market reality. This year, Porter has been invited to address the prestigious event, taking place October 28 to October 31, in, of course, New Orleans. To learn more about the legendary conference and to attend, follow this link…

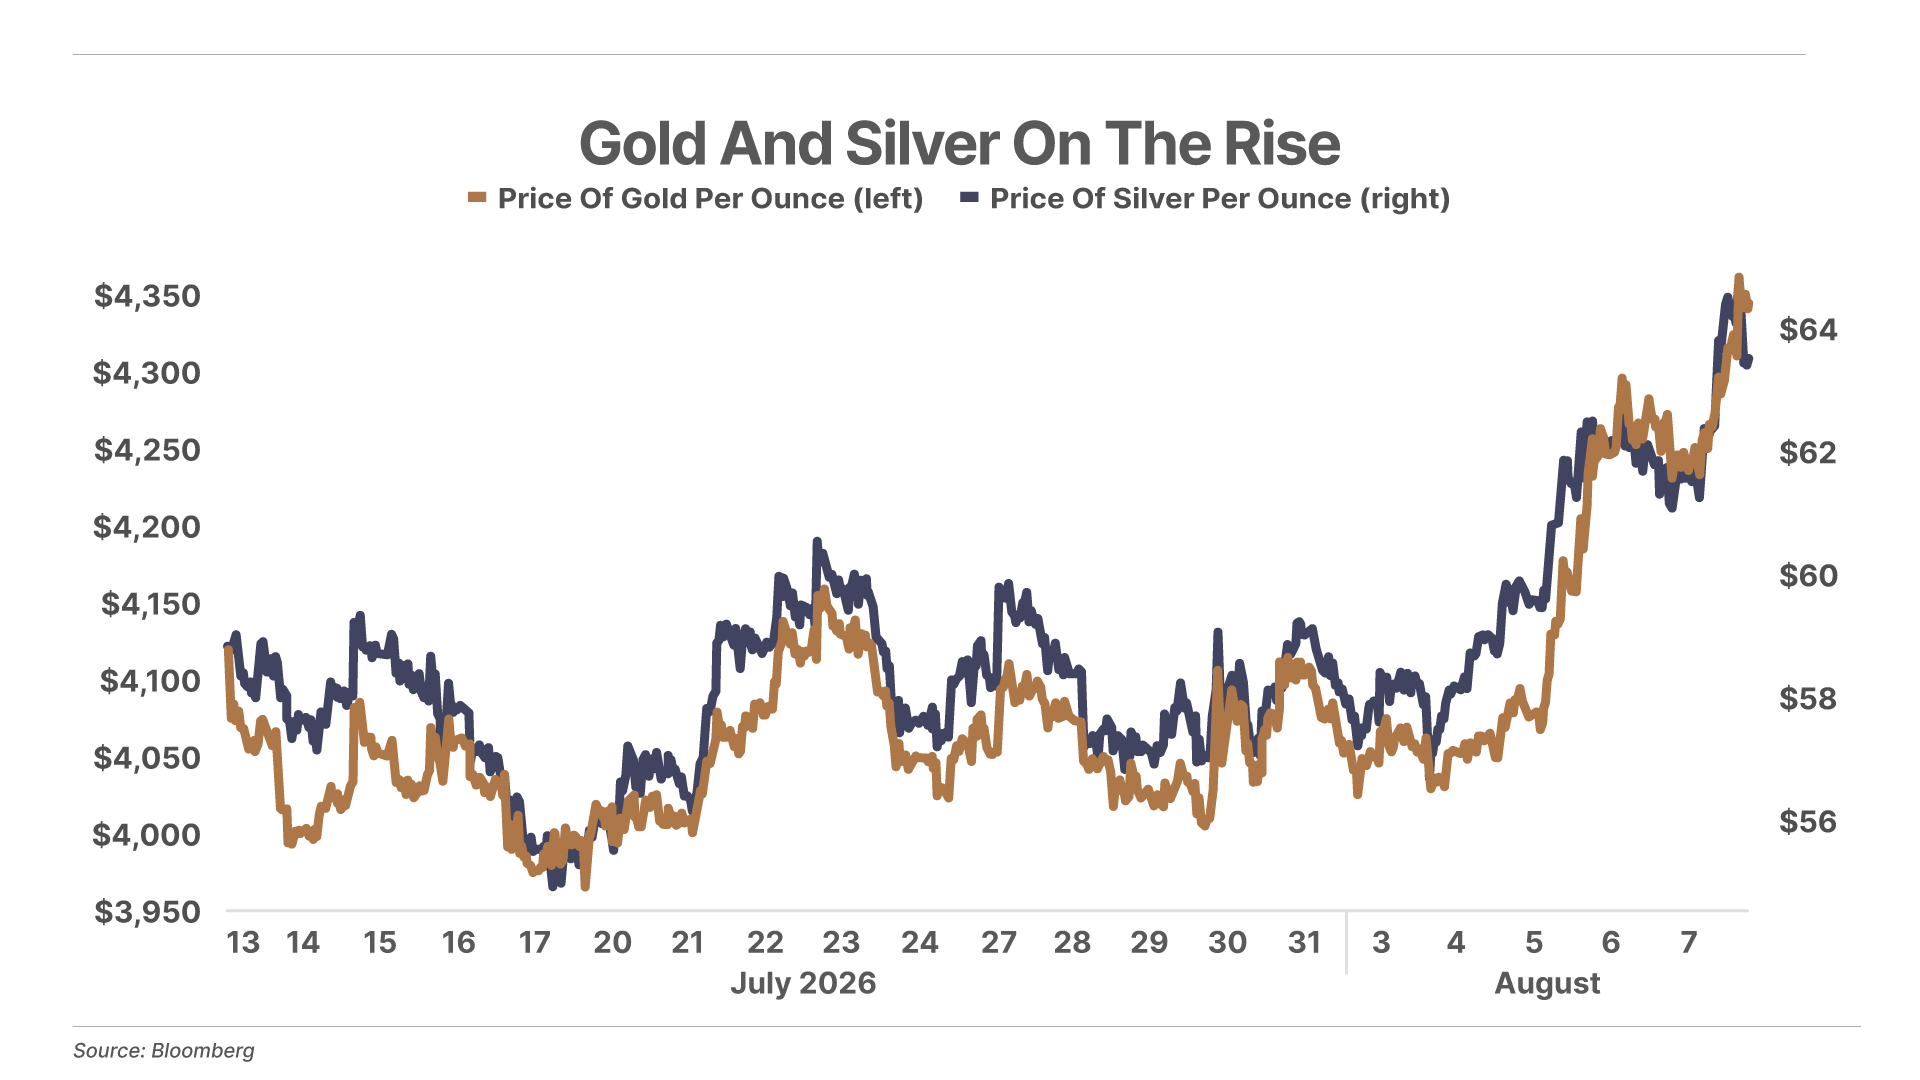
1. Gold and silver are ripping. Silver jumped 5% Friday toward $65 per ounce, up more than 10% on the week and 67% over the year, while gold is also up, at around $4,400 per ounce. Chinese gold ETFs just logged 14 straight days of inflows, after outflows in 38 of the prior 44 sessions. Central banks bought a record 289 tonnes in Q2, a 74% year-over-year jump. Investors afraid of the dollar move their money into gold.
2. Atlassian and Cloudflare refute the “AI kills software” trade. Collaboration software firm Atlassian (TEAM) went into Thursday’s earnings report priced as a company AI would displace, down 32% on the year. It then posted 28% revenue growth and cloud revenue accelerating to 31%. CEO and co-founder Mike Cannon-Brookes said: “AI is the best thing that ever happened to Atlassian” – shares are up 31% today. Meanwhile, internet services firm Cloudflare (NET) reported record growth in total paying customers. CEO Matthew Prince said AI and agents are now “core parts” of the company’s workforce and have “fundamentally changed” how it works. NET shares were up as much as 15% this morning.
3. The U.S. economy lost 23,000 jobs in July. Economists had expected a gain of about 83,000. The entire decline came from government payrolls, which fell 53,000. Private employers added 30,000 jobs. The Labor Department also revised May and June down by a combined 103,000, cutting May from 129,000 to 63,000 and June from 57,000 to 20,000. Wage growth slowed to 3.2% year over year, the weakest since May 2021. The market senses a decelerating economy: Traders cut the odds of a September Fed rate hike to 40% from 55% on Thursday, based on interest-rate futures tracked by CME Group.
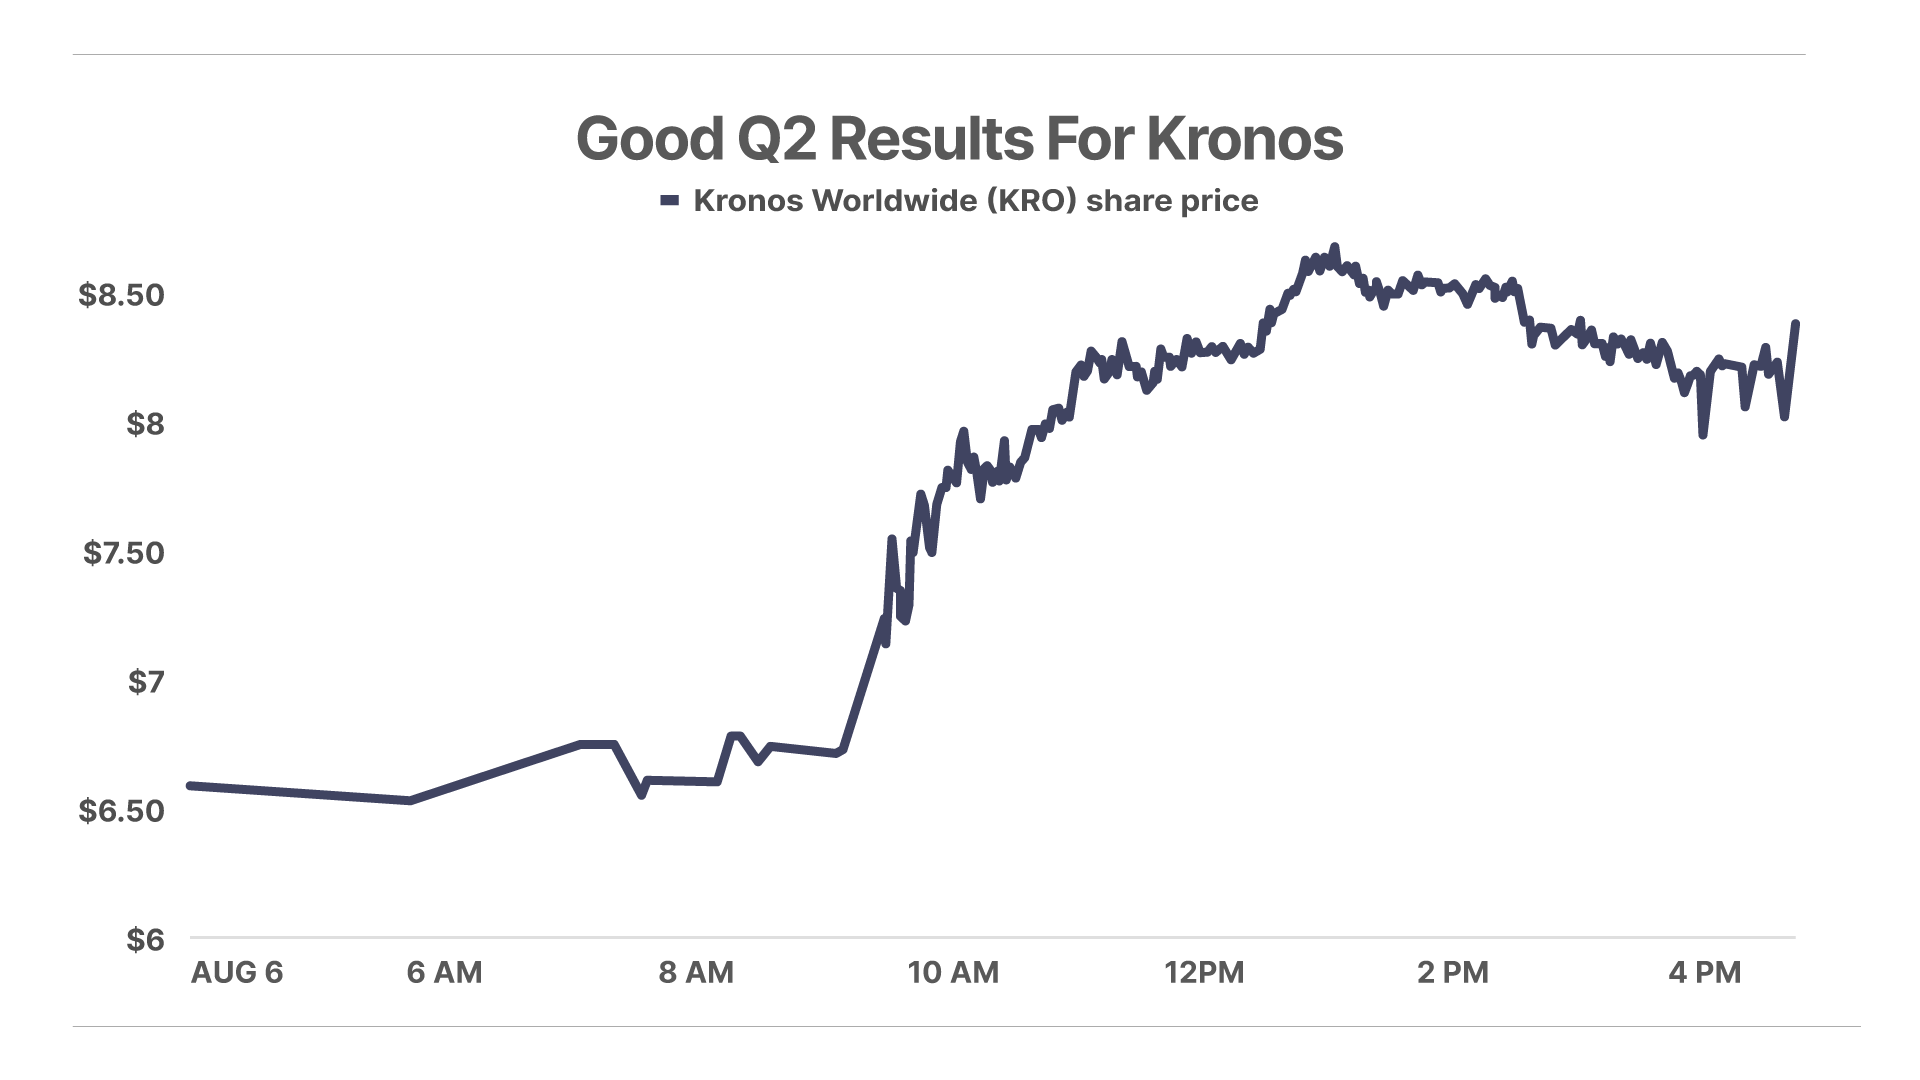
Shares of pigment-whitening producer Kronos Worldwide (KRO) jumped 35% yesterday to $8.55 after releasing stronger-than-anticipated Q2 results. The stock is up more than 80% since being recommended to Distressed Investing subscribers in December.
Yesterday, Distressed Investing analyst Andrew Lipman shared research on why AI might actually lead to lower inflation over time.
“Chimera”
Dan K. writes:
Inflation is always a monetary phenomenon. Cost push and demand pull inflation are chimeras, economic fallacies.
“All The Noise”
Robert S. writes:
The other aspect that might affect the AI buildout is that nobody wants a data center built next door to them because of all the water and energy they use – and noise too!
Porter & Co. Market Snapshot
| Price | Yesterday’s Return | Year-to-Date Return | |
| S&P 500 Index | $7,709.96 | -0.18% | 13.4% |
| Gold per ounce | $4,242.00 | -0.17% | 0.1% |
| Bitcoin | $64,262.11 | -0.61% | -25.9% |
| Oil (West Texas Intermediate) per barrel | $77.29 | 2.86% | 33.5% |
| Berkshire Hathaway (BRK) | $786,000.00 | 1.07% | 4.1% |
| Porter’s Permanent Portfolio | – | 0.47% | 3.1% |
| The Better Than Berkshire Index | – | -0.47% | 9.5% |
| Total Return | Annual Return | ||
| Porter & Co’s Top Ranked* | 35.5% | 16.8% | |
| Yield | Yesterday’s Change | Change Year-to-Date |
|
| U.S Treasury 30-Year Yield | 5.22% | 6 bps | 38 bps |
| Prices as of 4:00 pm ET August 6, 2026 | bps = basis points (or 0.01%) | |||
| *A Complete Investor risk rating of 1 is defined as a “low risk, high allocation” security, while positions rated closer to a 5 are higher risk. Porter & Co.’s top-ranked positions include those rated either 1 or 2 in Complete Investor portfolio. | |||
Porter & Co. Top Positions
| Publication | Ticker | Description | Total Return |
| Biotechnology | QURE | uniQure | 237% |
| Complete Investor | BWXT | BWX Technologies | 193% |
| Complete Investor | SKWD | Skyward Specialty Insurance | 166% |
| Biotechnology | SGMT | Sagimet Biosciences | 162% |
| Biotechnology | ROIV | Roivant Sciences | 155% |
| Biotechnology | NUVB | Nuvation Bio | 141% |
| Biotechnology | TGTX | TG Therapeutics | 140% |
| Complete Investor | BTC/USD | Bitcoin | 138% |
| Complete Investor | PM | Philip Morris | 134% |
| Biotechnology | QURE | uniQure | 131% |
| Prices as of 4:00 pm ET August 6, 2026 | |||
Please note: The investments in our “Porter & Co. Top Positions” should not be considered current recommendations. These positions are the best performers across our publications – and the securities listed may (or may not) be above the current buy-up-to price. To learn more, visit the current recommendations page of the relevant service, here| New Window. To gain access or to learn more about our current recommendations, call our Customer Care team at 888-610-8895 or internationally at +1 443-815-4447.