Junk Shouldn’t Beat Quality
Inside Today's Issue
- Essay: Junk Shouldn’t Beat Quality
- Measuring Paychecks In Gold
- More AI-Debt Stress
- Revising Jobs Downward
- Chart Of The Day… Philip Morris International (PM)
- Today’s Mailbag
For the last three years, junk stocks beat quality stocks by the widest margin ever.
From November 2023 through June 2026, a portfolio that owned America’s highest-quality businesses and sold short its lowest-quality businesses lost 36%. That’s the worst stretch ever for quality stocks versus junk stocks.
The opposite normally occurs. Hedge funds make money buying great companies (quality) and selling weak ones (junk). But during rare periods, the market’s discounting mechanism breaks down and, for a little while at least, junk beats quality.
When this happens in conjunction with tech-stock mania, it’s a stark warning that our economy is heading for trouble. Let me explain how all this is measured and then I’ll explain what it means for us today.
I’m sure as an investor you’ve had the experience of buying a very good business that keeps racking up great earnings results, but that the market seems to steadfastly ignore. It’s almost like the market is broken.
And, in fact, there are times when the market’s normal function does break down.
Cliff Asness, who earned his PhD in finance at the University of Chicago, created a metric to identify and quantify when this happens and for how long. It’s called the Quality Minus Junk Factor (“QMJ”).
Asness studied under Eugene Fama, the economist who later won a Nobel Prize for his work on stock prices. Fama’s work proved that the market is relatively efficient. Most of the time, he showed, the market accurately prices the value of the underlying business, which makes it hard to beat the market (an index fund) over time.
Asness went to work at Goldman Sachs, where he hired Robert Krail and John Liew. They used computers to find and buy cheap stocks that had started to rise, while selling short expensive stocks that had begun to stall. It worked. So in 1995, the group started a hedge fund for Goldman partners and a few clients. Within two years, the fund managed $7 billion. Then in 1998, Asness, Krail, Liew, and another colleague, David Kabiller, founded AQR (Applied Quantitative Research), with 10 employees in New York City. By August 1998, they had $1 billion committed, which, at the time, was the largest hedge fund launch in history.
They walked straight into a nightmare. That was the beginning of the dot-com bubble. Investors bid up anything with a dot-com address (junk) and dumped high-quality stocks, like the kind AQR owned. Over its first 20 months, AQR incurred 35% losses.
The pain peaked in March 2000. But then the bubble burst and AQR’s model resumed working. By 2005 the firm was managing about $13.5 billion.
But that wasn’t the last time the market would go haywire.
Quality badly lagged junk from 2019 through 2020. Once again, anything tied to technology (remember the huge moves in crypto and NFTs?) rallied. AQR lost half its assets.
This time, though, Asness knew exactly what was happening. In 2013, Asness and two AQR colleagues, Andrea Frazzini and Lasse Heje Pedersen, released a paper called “Quality Minus Junk.” The Review of Accounting Studies published it in 2019. I’ll assume you missed that issue.
The authors defined quality as the traits investors should pay more for: profitability, growth, and safety. Each is built from accounting and stock-price data that’s publicly available.
Profitability is easy to understand, and Asness uses six different measures of it. Growth is easy to understand too: Asness uses changes to earnings per share over the previous five years. Safety measures how likely a business is to disappoint you. It starts with beta, which measures a stock’s volatility relative to the S&P 500. It also uses two long-established formulas of balance sheet stability – Ohlson’s O-Score and Altman’s Z-Score. The last measure is stable earnings, meaning low volatility in return on equity over the past five years.
Using a bunch of fancy math, Asness puts all these factors into a single numerical score and then ranks every stock that trades in the U.S. The QMJ index then “buys” the 30% of stocks with the highest-quality score and sells short the 30% with the lowest-quality score. Each position is sized by market value, and the portfolios are rebalanced every month. The return of the quality portfolio minus the return of the junk portfolio is the QMJ factor. AQR publishes it every month, with U.S. data going back to July 1957.
Notice what the quality score leaves out: price. QMJ never asks whether a stock is cheap, so a quality stock can be expensive and a junk stock can be priced for bankruptcy. In theory, the market should price these differences in quality efficiently, meaning that simply buying quality and selling junk wouldn’t produce a lasting advantage. But that’s not what happens.
Asness has proven that investors systematically misprice quality. Or, in other words, buying high-quality stocks normally gives investors a slight edge. From July 1957 through August 2026, quality beat junk by 3.6% a year. Over time, that creates massive outperformance.
Thus, most of the time, the market shows a rational preference for quality. Every so often, though, junk beats quality. Sometimes for years.
We went through AQR’s monthly data back to 1957 and found eight losing runs of 10% or more for the QMJ portfolio, measured from a high to a low:
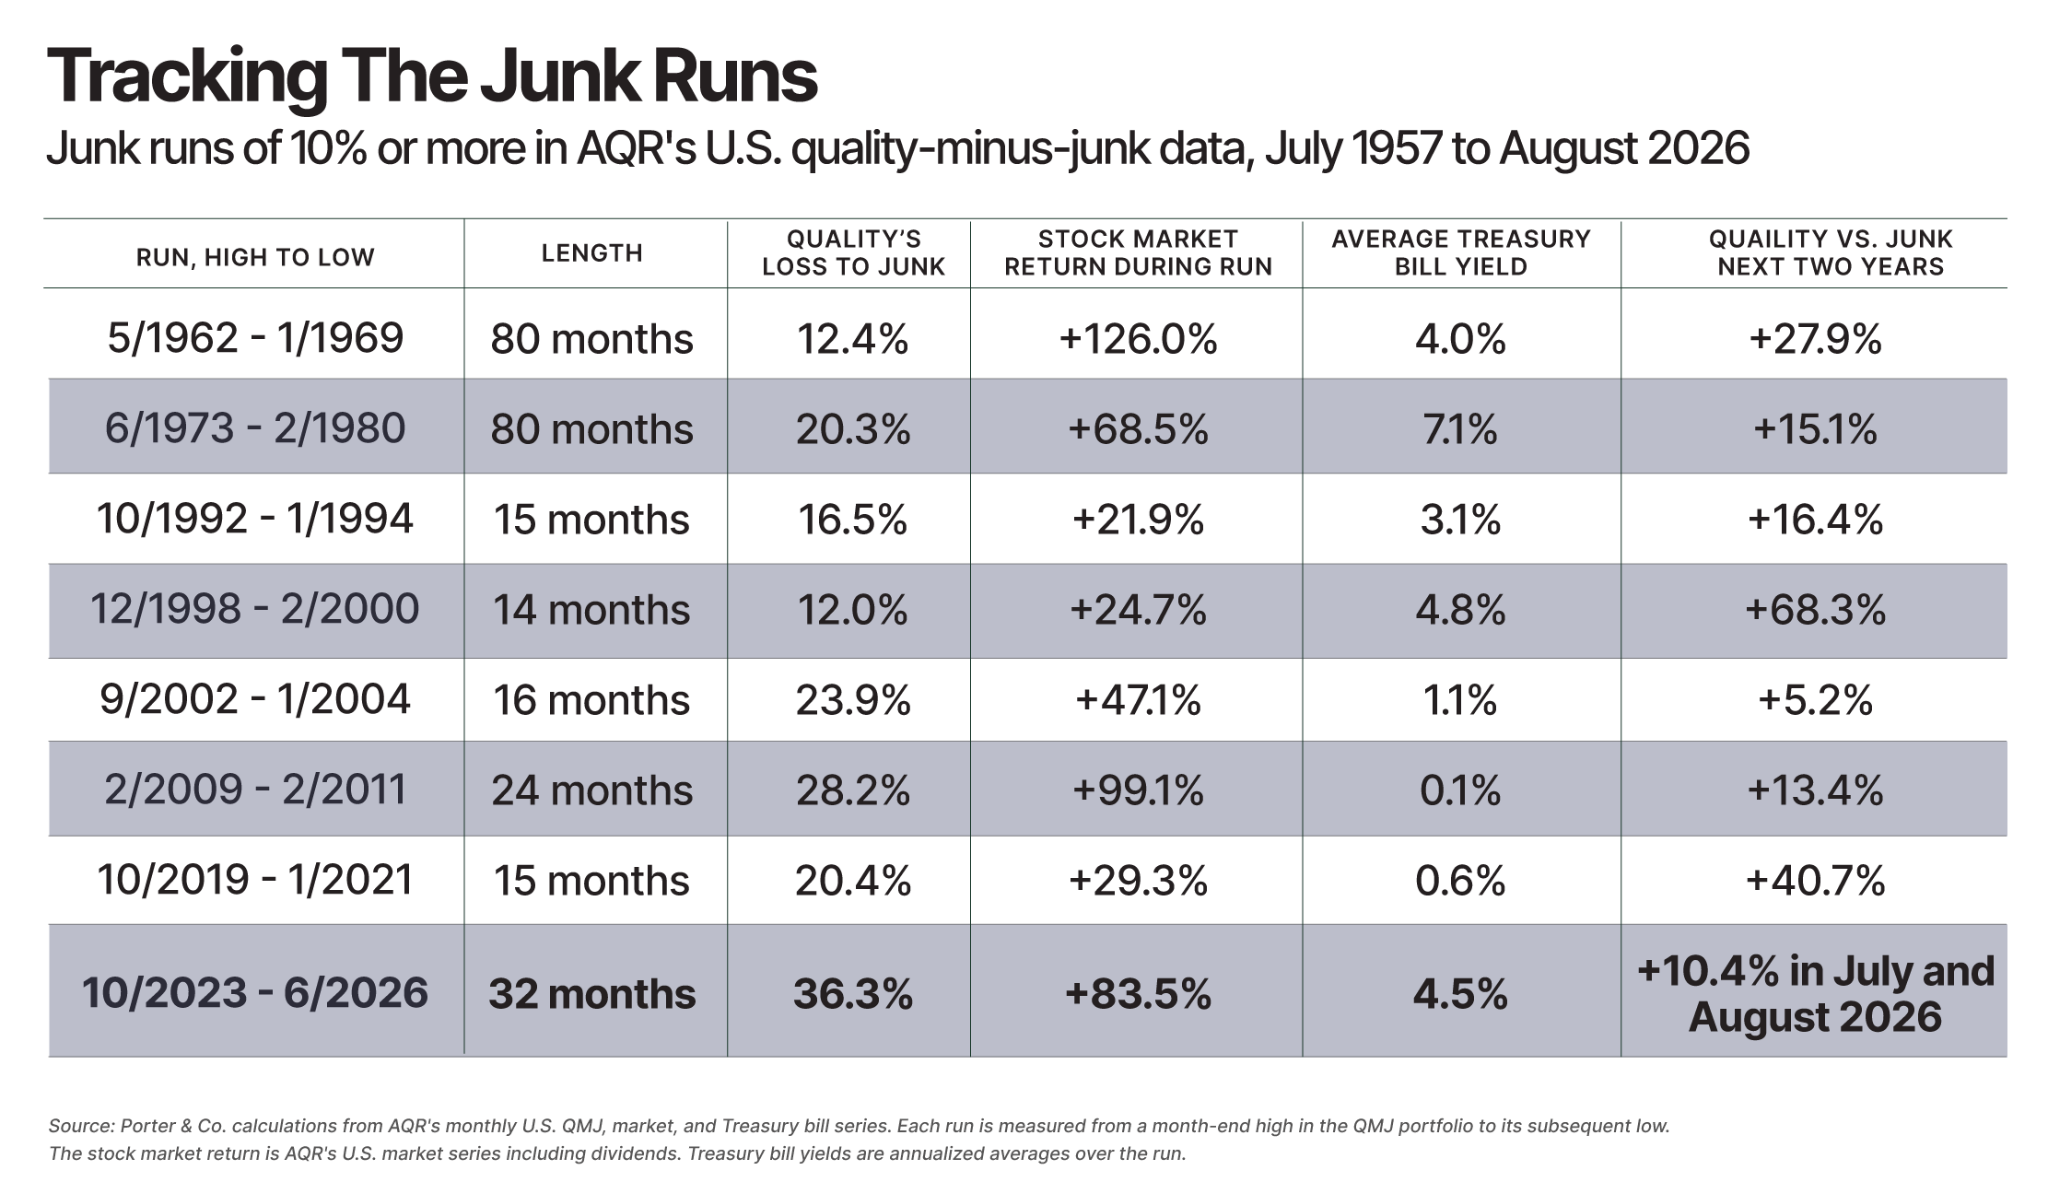
Each run is measured from a month-end high in the QMJ portfolio to its subsequent low. The stock market return is AQR’s U.S. market series including dividends. Treasury bill yields are annualized averages over the run.
The 1960s were the go-go years. Trading volume swamped Wall Street’s back offices, and for months the New York Stock Exchange closed on Wednesdays so brokers could catch up on paperwork. The financial writer John Brooks built a “neo-Dow” of 30 glamour stocks of the decade: conglomerates such as Litton Industries and Ling-Temco-Vought, computer stocks such as Leasco Data Processing and Sperry Rand, technology stocks such as Polaroid and Fairchild Camera. In 1969 and 1970, they fell an average of 81%, while the Dow Jones Industrial Average fell 36%.
In the two years after junk peaked in January 1969, quality beat junk by 28%, while the stock market lost 4.5%.
During the internet bubble, junk beat quality by 12% from December 1998 through February 2000. Over the next two years, quality beat junk by 68%, while the stock market lost 24%.
From October 2019 through January 2021, through the COVID crash, zero interest rates, and the meme-stock and crypto mania, junk beat quality by 20%. Over the next two years, quality beat junk by 41%, while the market only gained 6%.
Two explanations come up whenever junk wins: investor euphoria and a technological breakthrough, or extremely low real interest rates and a market rebounding after a bear market. If interest rates are low enough and if junk is cheap enough, junk can win.
The most notable cause of junk beating quality is technological innovation. Inventors deliver a real technology and then investors extrapolate it without limit. It happened with computers and electronics in the 1960s, with the internet in 1999, and with electric cars, crypto, and remote work in 2020.
These periods always end very badly for junk investors.
In the two years after each of these periods, quality beat junk by 28%, 68%, and 41%. The stock market over the same three periods returned negative 4.5%, negative 23.5%, and 6.4%. (The market only gained in the last instance because it was coming off the entire COVID-19 collapse.)
There’s one market period when junk beating quality is a good sign. And that’s after a major bear market. A crash drives the weakest companies to prices that assume they will fail. Then the central bank floods the system with cheap money, the weak companies survive, and their shares double or triple off the bottom. The 1970s, 1992, 2002, and 2009 runs all fit this model. In a market rebounding off a serious bear market, junk stocks are cheap, and cheap stocks can keep rising for a long time.
The current junk market began in late 2023 and continued as the S&P 500 set one record after another. Junk was beating quality not because the market was coming off a deep bear market, but once again because of investor euphoria over a new technology: artificial intelligence.
This is a “tech-driven junk bubble,” and by our count it is the largest on record.
The 12 months ending in May 2026 were the worst 12 months for quality in AQR’s 69-year record.
Quality lost in 2023, 2024, and 2025, and it was down 3.8% this year through August.
The junk bubble is obvious. A Goldman Sachs basket of money-losing technology companies rose 57% in the first five months of 2026, against 11% for the S&P 500, according to Bloomberg. The Russell 2000, an index of small companies in which more than one company in four loses money, gained 22.7% in the first half, more than double the return of large companies.
But the junk bubble is over.
In July, quality beat junk by 14.3%, its largest one-month gain since 1957. And Goldman’s basket of money-losing tech stocks fell 11% in Q3.
And that means it’s time to be cautious. When big junk bubbles roll over, the stock market overall does poorly. The two next-largest monthly wins for quality happened in November 2000 and October 2008 – just before big bear markets.
Where should you be investing now?
Quality is coming back. Since June 30, Procter & Gamble (PG) rose 12.9% (and is heading for its best month since October 1998), Colgate-Palmolive (CL) is up 6.2%, Church & Dwight (CHD) 12.4%, and Coca-Cola (KO) 17.3%. The S&P 500 rose 2.3%. And junk is getting killed. AST SpaceMobile (ASTS) is down 56%, and D-Wave Quantum (QBTS) is down 52%.
When you see our current selection of Best Buys to be released tomorrow, you know that we are leaning into quality at Porter & Co. I hope you’ll do the same!
If you are not yet a Best Buys subscriber and would like to see the October selection, click here.
Tell me what you think of today’s Daily Journal: porterstansberrydirect@gmail.com
Good investing,
F. Porter Stansberry
Stevenson, Maryland

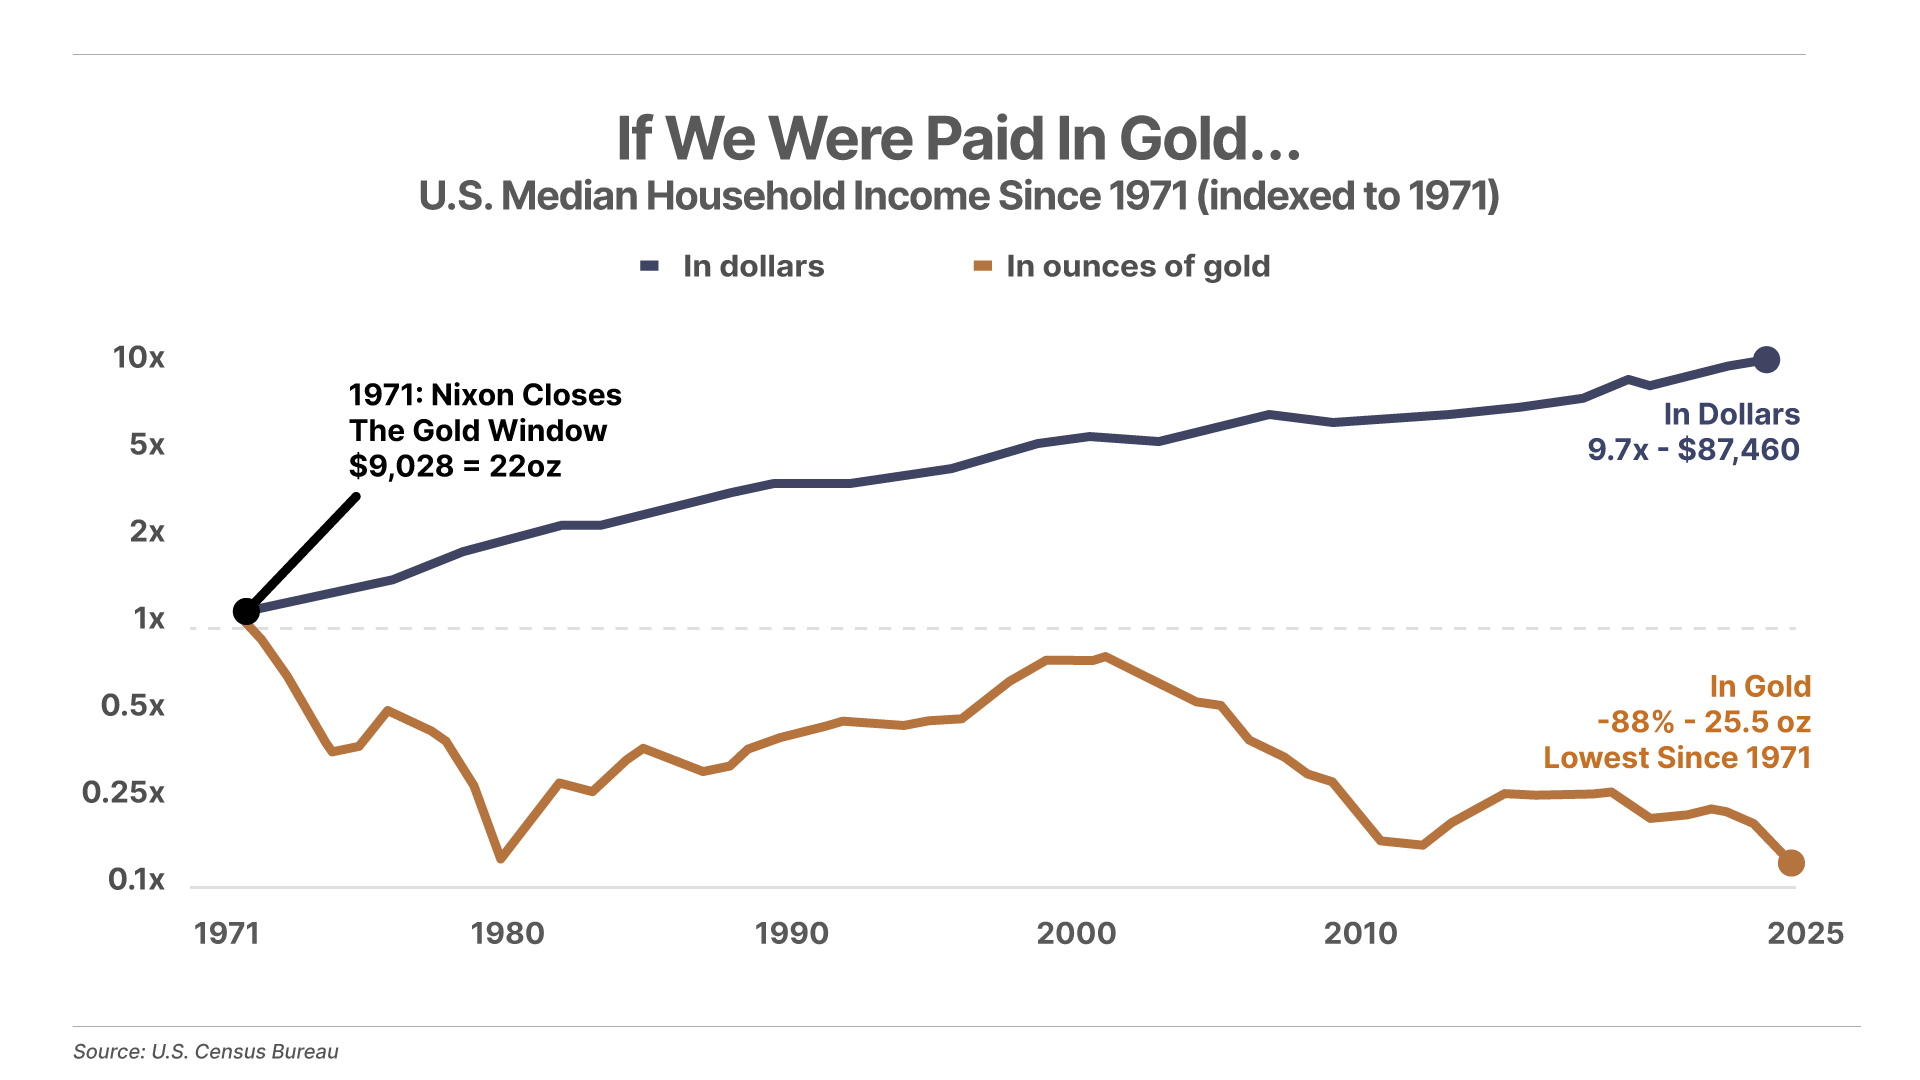
1. The median American household now earns 25 ounces of gold a year compared to 220 in 1971. The U.S. Census Bureau's latest income report puts the 2025 median at $87,460, a record in dollars and up nearly tenfold from the 1971 figure of $9,028, the year Nixon ended gold convertibility. Divide each year's income by that year's average gold price and the record disappears. Measured in gold, the median household earns 88% less than it did in 1971, the lowest reading in the 54 years since. Adjusted for the government's own inflation index, real income is up 46% over that span. Gold says the index is understating the damage.
2. Another sign of rising AI funding stress. Morgan Stanley can’t find buyers for a $300 million commercial mortgage-backed bond tied to a data center in Kansas City. Privately held neocloud company Lambda is the sole operator of the facility. Nvidia (NVDA) has invested over half a billion into Lambda, and has also provided a financial backstop for the company by agreeing to purchase future compute. The lack of interest in these data center bonds despite Nvidia’s backing is the latest signal of funding strains in the AI build-out.
3. The 2025 jobs report was overstated by 90%. Each monthly payroll number the Bureau of Labor Statistics (“BLS”) released last year was revised at least twice after the fact. Three months the BLS first reported as gains, June, August, and December, are now losses. The 2025 adjustment – from 1.2 million down to 116,000 – was the largest in the 11 years the BLS publishes revisions. Markets spent 2025 pricing a labor market that was adding 100,000 jobs a month on paper. The real number was under 10,000.
Shares of nicotine producer Philip Morris International (PM) have risen 25% year to date and 6% over the last month – after being included once again as part of Best Buys, in September. We release the next selection of Best Buys tomorrow at 10 am.
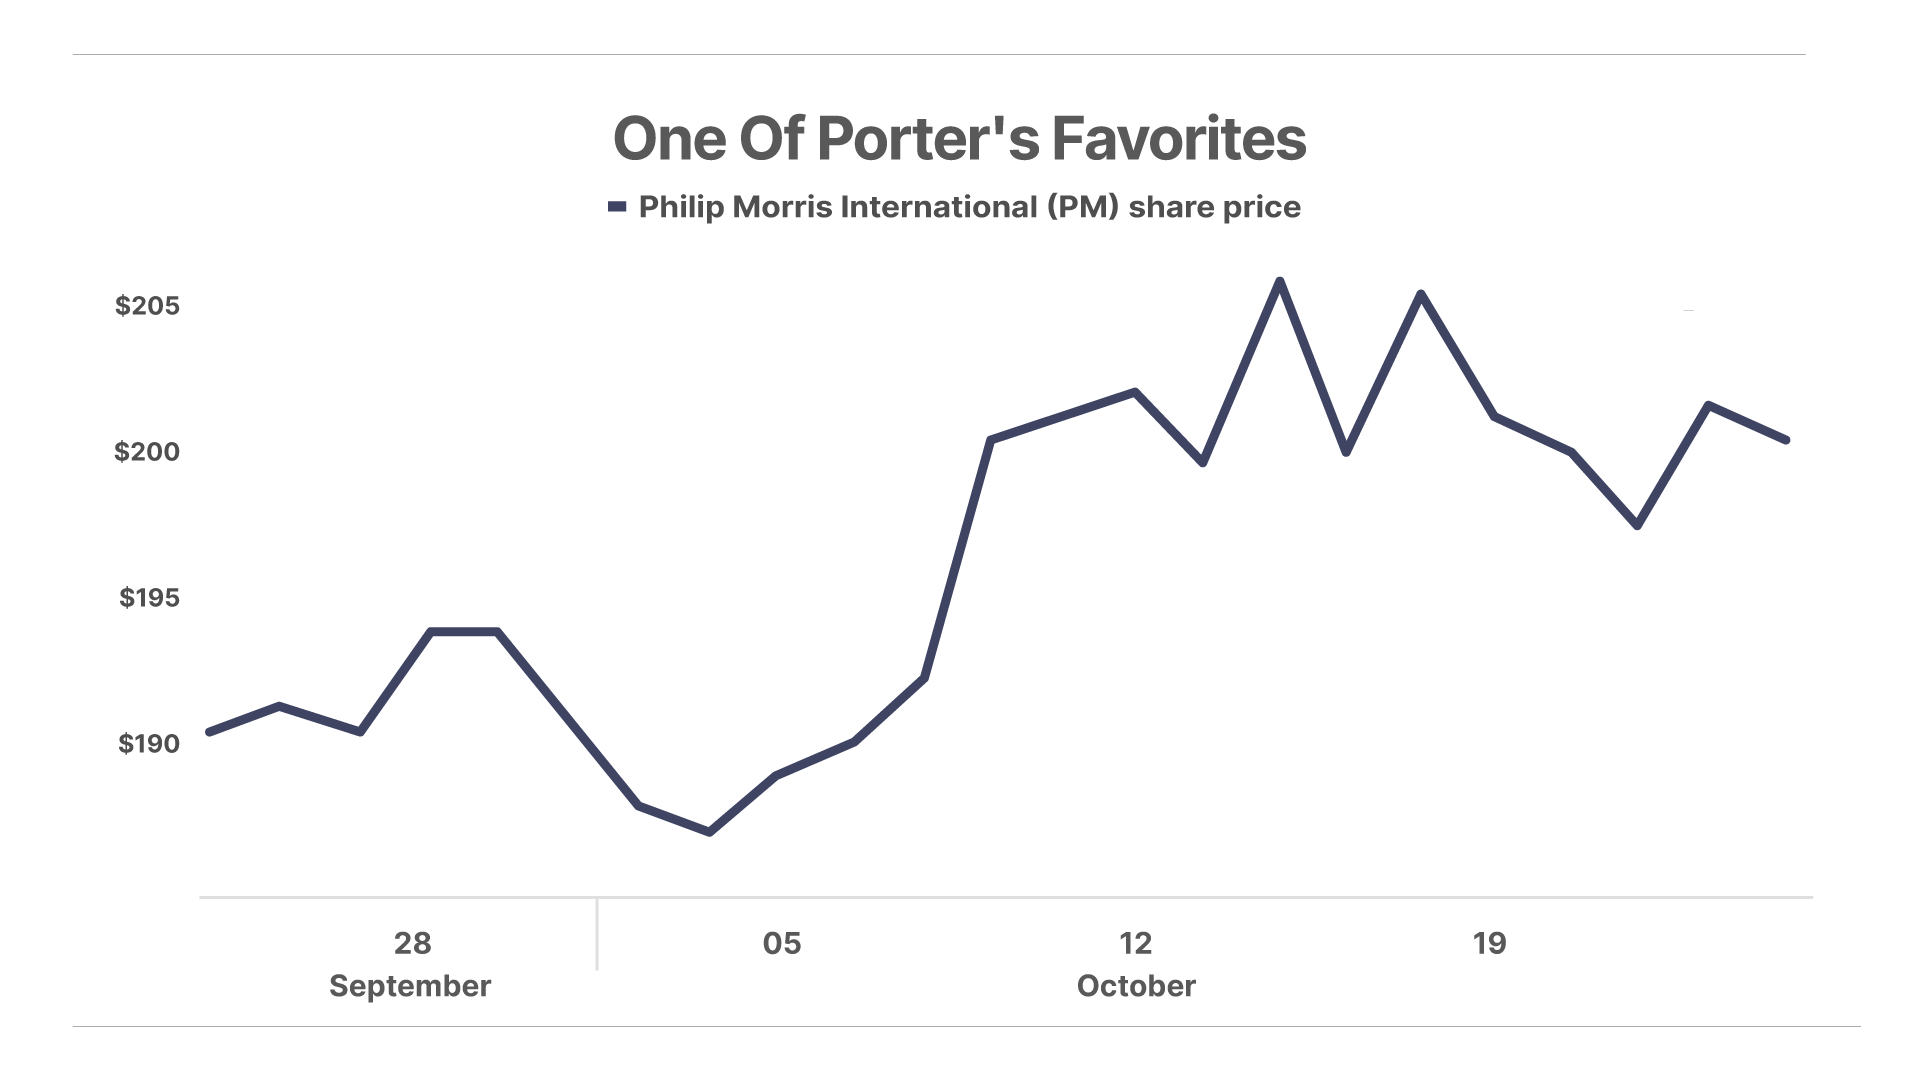
If you are not yet a Best Buys subscriber and would like to see the October selection, click here. Shares of Philip Morris are up 143% since we originally recommended them as a Best Buy.
Porter turned yesterday’s Journal over to Handre van Heerden, a young Austrian School economist from South Africa who has become one of Porter’s favorite writers on X.com (@Handre). Handre wrote about why using debt is so powerful during times of high inflation.
Yuma writes:
Love to see young people following Austrian economics.
Dan S. writes:
Handre is a real plus – excellent addition!
Vihang E. writes:
This is an excellent piece. At the end you mention that, "I’m almost certainly going to be a buyer of the stock. I just want to wait until it’s mostly freely trading first."
Please let the Partners know when that happens. Thank you.”
Porter & Co. Top Positions |
Through Wednesday, October 22, 2026 close |
| # | Position | Total return |
|---|---|---|
| 1 |
uniQure QURE
Biotechnology
|
+237% |
| 2 |
Bitcoin BTC/USD
The Complete Investor
|
+201% |
| 3 |
Sagimet Biosciences SGMT
Biotechnology
|
+184% |
| 4 |
Roivant Sciences ROIV
Biotechnology
|
+165% |
| 5 |
Skyward Specialty Insurance SKWD
The Complete Investor
|
+152% |
| 6 |
Philip Morris PM
The Complete Investor
|
+151% |
| 7 |
TG Therapeutics TGXT
Biotechnology
|
+139% |
| 8 |
uniQure QURE
Biotechnology
|
+131% |
| 9 |
BWX Technologies BWXT
The Complete Investor
|
+125% |
| 10 |
Sagimet Biosciences SGMT
Biotechnology
|
+123% |