A Century Of Double-Digit Gains After Off-Year Elections
Inside Today's Issue
- Essay: The Midterm Miracle
- Interest Expense At An All-Time High
- Gold In The Bank, Not On Your Wrist
- A Biotech Buyout
- Chart Of The Day… AI Debt
- Today’s Mailbag
Editor’s note: Two weeks before the U.S. midterm elections, Porter turns today’s Journal over to editorial director Geoffrey Morris, who spent more than a decade as a political reporter for National Review, Reader’s Digest, and other publications.
We can more accurately predict how the market will perform after midterm elections than who will control the U.S. House and Senate… But not all investors buy into this history.
In November 1994, Newt Gingrich’s "Contract With America" swept Republicans into control of both houses of Congress for the first time in 40 years. Leading up to the vote, conventional financial commentary warned of impending gridlock, institutional paralysis, and fiscal chaos. Terrified retail investors liquidated equities, expecting a severe market correction. Instead, the S&P 500 embarked on one of its most explosive bull runs of the decade, returning 30% in 1995. Those who sold out of political dread missed one of the best runs in modern market history.
Then, ahead of the 2006 midterm elections – with President George W. Bush halfway through his second term – as Democratic control of Congress loomed, mainstream-media pundits endlessly debated which sectors would be crushed by impending regulatory tightening. Investors who panicked and rotated entirely out of favored sectors based on predicted committee chair changes missed the market's continued upward march. Within 12 months of the election, the broader market was firmly higher, proving once again that Washington's power struggles are largely background noise to underlying corporate earnings power.
Two weeks from tonight, midterm elections results will be mostly known. Looking back across the last 25 midterm election cycles – stretching from the 1920s to now – the performance of the S&P 500 in the 12 months following a midterm election is extraordinary.
Over the past century, stock market performance in the year following a midterm election shows a consistency rarely matched by any other macro indicator:
- Over 12 months: In roughly 90% of midterm cycles since 1920, the U.S. stock market was higher 12 months after the election than on election day
- Strong average 12-month gain: The average S&P 500 return in the 12 months following a midterm election is approximately 16%, nearly double the average 8.1% annual return of non-midterm years
- The year-3 effect: In the standard four-year presidential cycle, year 3 – the calendar year immediately following the midterm election (2027 in this cycle) – is historically the strongest of all four years, averaging gains above 16%
Let’s look at why this happens.
Investors often assume that a "flip" in either the House or the Senate creates instability that hurts stock prices. The historical data proves the exact opposite.
How the government is aligned after the midterms matters slightly more than if there was a shift in power from Republican to Democrat or if things remain unchanged. No matter what happens, the market historically moves higher post-midterm, but the composition of Washington after the votes are counted does alter the magnitude of market returns.
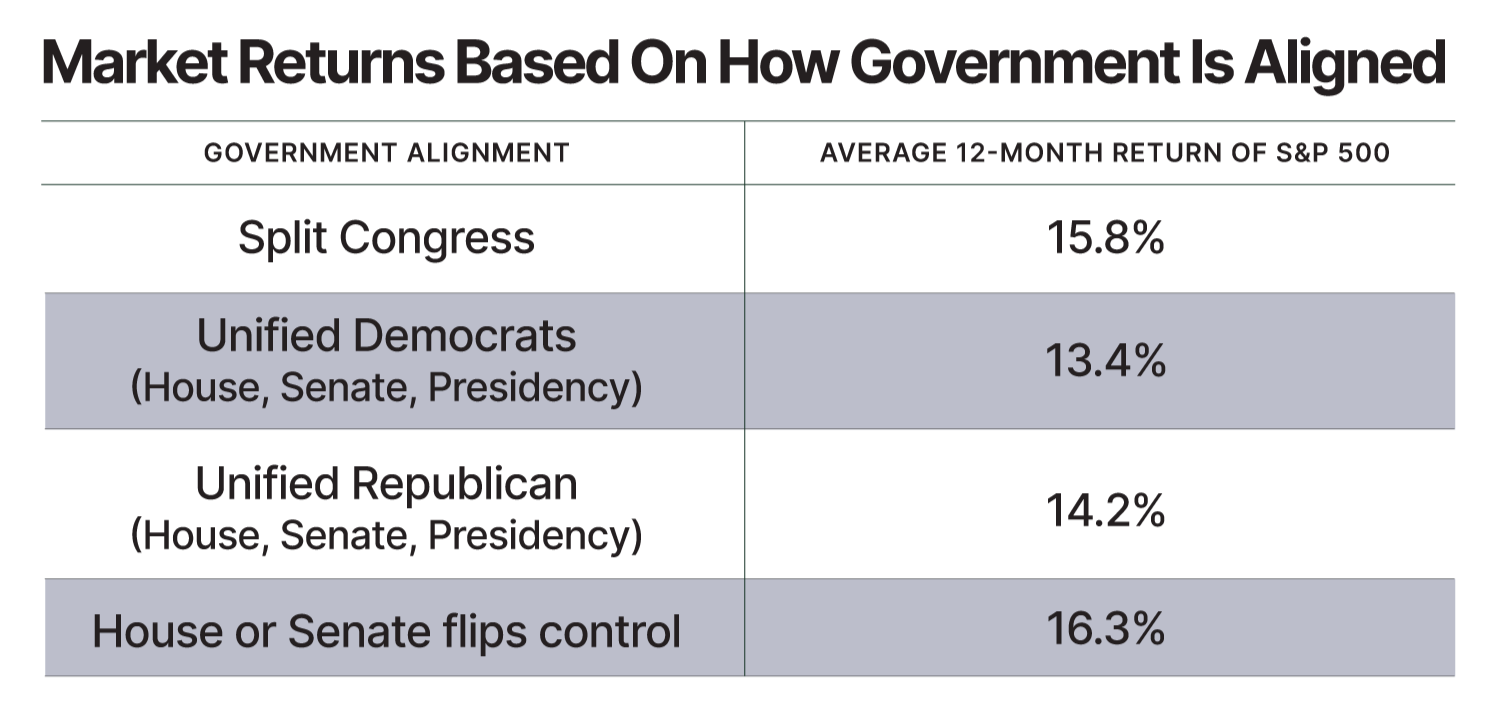
The market’s absolute favorite outcome is divided government.
When control of the House or Senate changes hands – forcing a split between the executive and legislative branches – the S&P 500 has historically posted its strongest post-election gains.
Another sign that Wall Street views legislative gridlock as an asset, not a liability. When power is divided, major tax hikes, dramatic regulatory shifts, and sweeping industrial re-engineering become virtually impossible to pass. With no change coming, companies know what the regulatory landscape is, allowing them to deploy cash into long-term capex, research, and share buybacks without fear of abrupt policy reversals.
The Three Drivers Behind The Post-Midterm Surge
So with returns averaging between 13.4% and 16.8%, it’s clear the partisan makeup of government does not matter so much – those are all strong returns. So let’s look at what actually drives the market higher. History points to three factors.
1. Policy Resolution In the six months leading up to a midterm election (typically May through October of year 2 – the last six months), the stock market historically underperforms. Volatility rises, and average monthly returns drop significantly below trend.
This underperformance is not caused by fear of a specific candidate – it is caused by uncertainty. Institutional capital dislikes operating in a vacuum. Fund managers reduce leverage, hold higher cash balances, and defer strategic investments until they know which party will hold committee chairs, tax-writing authority, and oversight powers.
Once election day passes, the policy fog clears. Even if the market dislikes the political outcome, certainty is better than uncertainty. Capital that sat on the sidelines during the late summer and early autumn flows back into equities, producing a sharp, reliable relief rally through the winter months.
2. The Presidential Fiscal Cycle During the first two years of a presidential term, administrations typically push their most controversial, politically costly legislative initiatives – such as major regulatory adjustments or tax realignments. By year 3 (the year directly following midterms – right now), the political focus pivots.
Historically, sitting administrations use year 3 to roll out market-friendly initiatives: accelerating spending programs, supporting credit markets, avoiding controversial executive actions, and promoting economic growth. This systematic pulse of fiscal and regulatory accommodation provides a welcome environment for traditionally risky assets.
3. Seasonal Alignment The midterm election cycle aligns almost perfectly with the standard seasonal strength of equity markets.
Historically, November through April represents the strongest six-month period of the year for the S&P 500. When this natural seasonal momentum coincides with the resolution of midterm election uncertainty, the combined effect can trigger powerful multi-month market advances.
The historical record over the last 100 years of U.S. stock market data leads to one clear conclusion: political opinions don’t necessarily play into investment decision-making.
Partisans who pull capital out of the market because their preferred party lost control of the House or Senate routinely miss out on strong market runs. The last 100 years have demonstrated that.
Right now, the Democrats are favored to win control of the House and the Senate, which are currently both controlled by Republicans. Historically, the market has averaged a gain of 16.3% with the new political makeup. If Democrats only win one chamber (likely the U.S. House), the historical average returns in that scenario are 15.8%.
Whatever happens, it seems that midterm elections serve as a major clearing mechanism for political risk – as certainty moves front and center.
Tell us what you think of today’s Daily Journal: porterstansberrydirect@gmail.com
Geoffrey Morris
Ridgefield, Connecticut

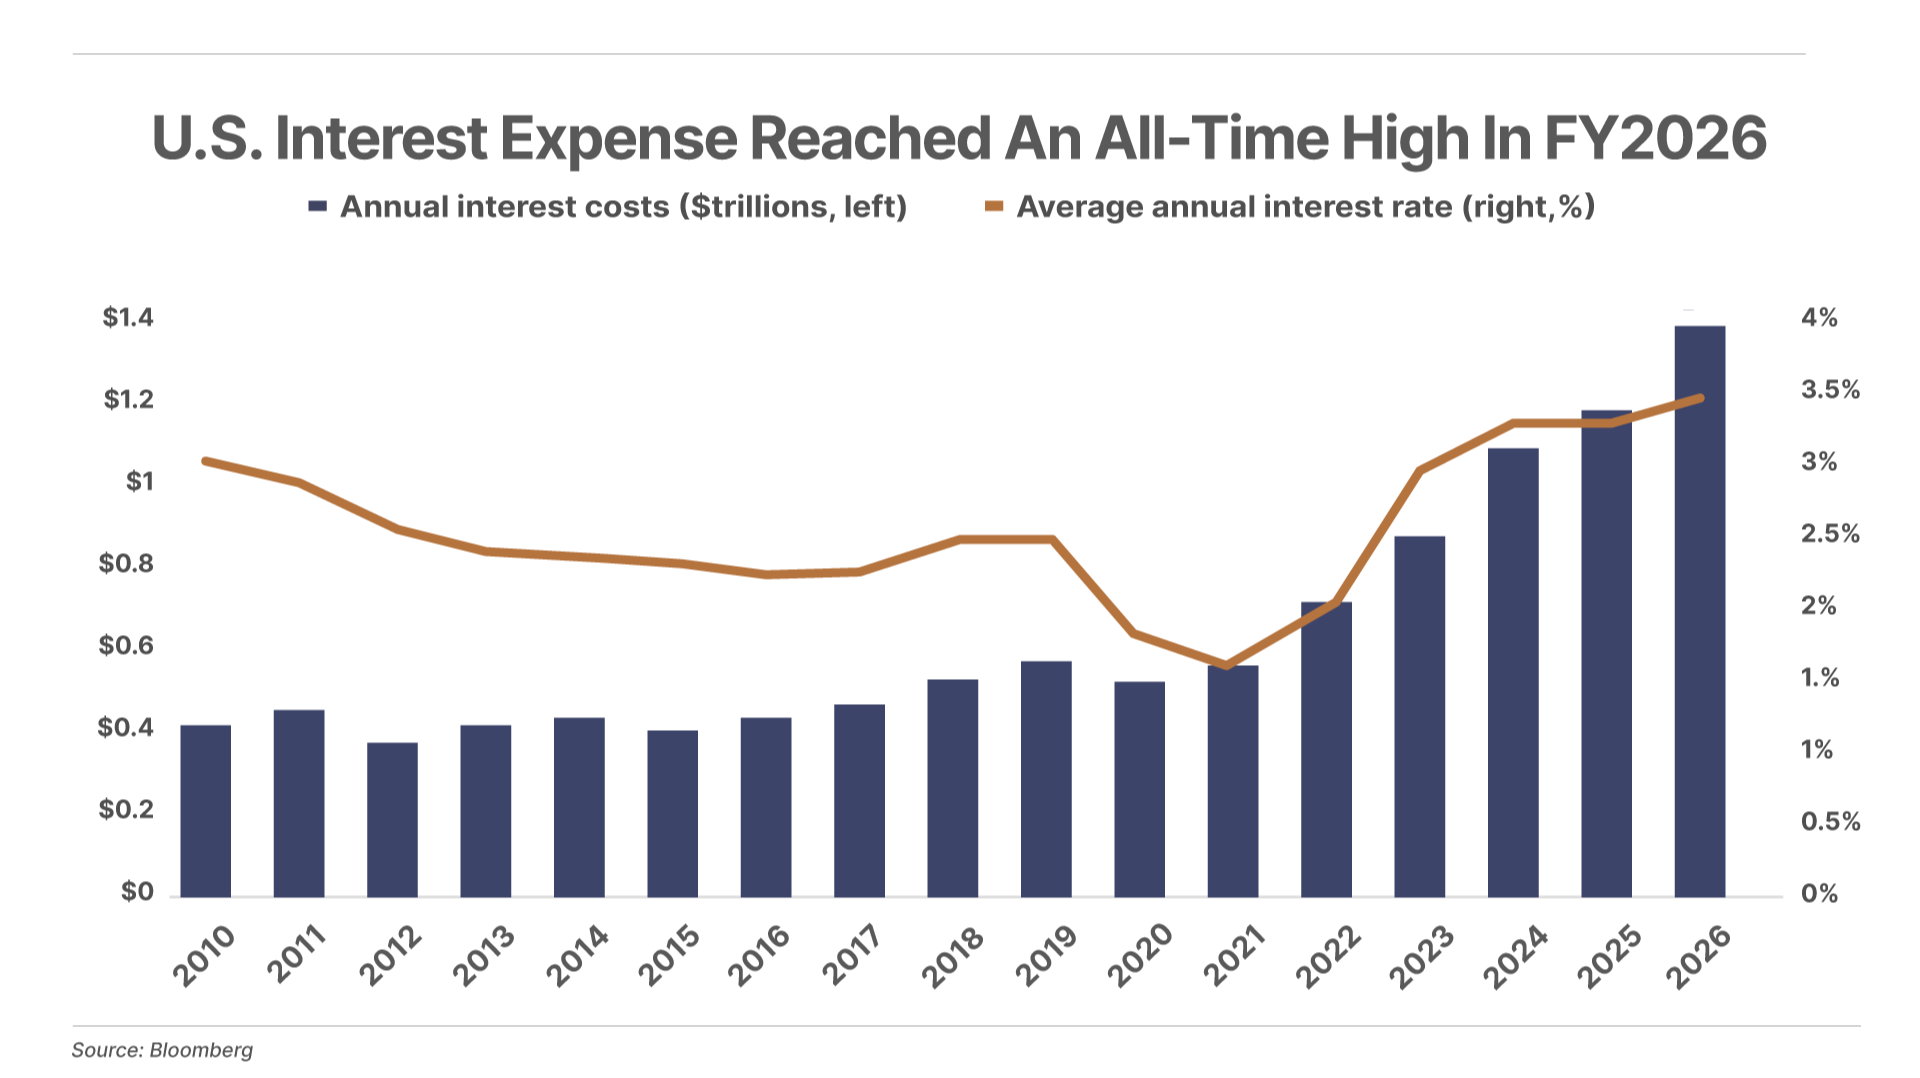
1. Interest is now the federal government’s second-largest expense. The Treasury paid a record $1.4 trillion in interest in fiscal 2026, which ended September 30 – about 2.7x the 2020 total. Net interest, which excludes interest the government pays itself on bonds held by Social Security and other federal trust funds, was $1.14 trillion, triple 2020’s level. That exceeds spending on Medicare and defense and trails only Social Security. The average rate on federal debt has more than doubled since 2021, to roughly 3.5%.
2. Investors drive the gold bull market. Last year, investor demand for gold exceeded jewelry demand for the first time ever. This trend has continued into 2026, led by Chinese investors who acquired a total of 342 tons of gold in the first half of the year – a record pace of buying. This compared with just 136 tons consumed from Chinese jewelers. This marks a significant shift in the gold market, as investors around the world increasingly flock to the precious metal as a safe haven against monetary debasement.
3. Merck buys Silence Therapeutics for $20 per share. Porter recommended Silence (SLN) to Biotechnology subscribers on August 1 near $11 as a speculative buy. Now, Merck is acquiring the clinical-stage gene-silencing company for a 130% premium to Friday’s close. On September 5, Porter raised the buy-below price to $16 per share and the present value estimate to $22. Merck is now paying $20, nearly 2x the original recommended price.
Not already a subscriber to Porter & Co. Biotechnology? Click here to learn more and get Porter’s next issue on November 7.
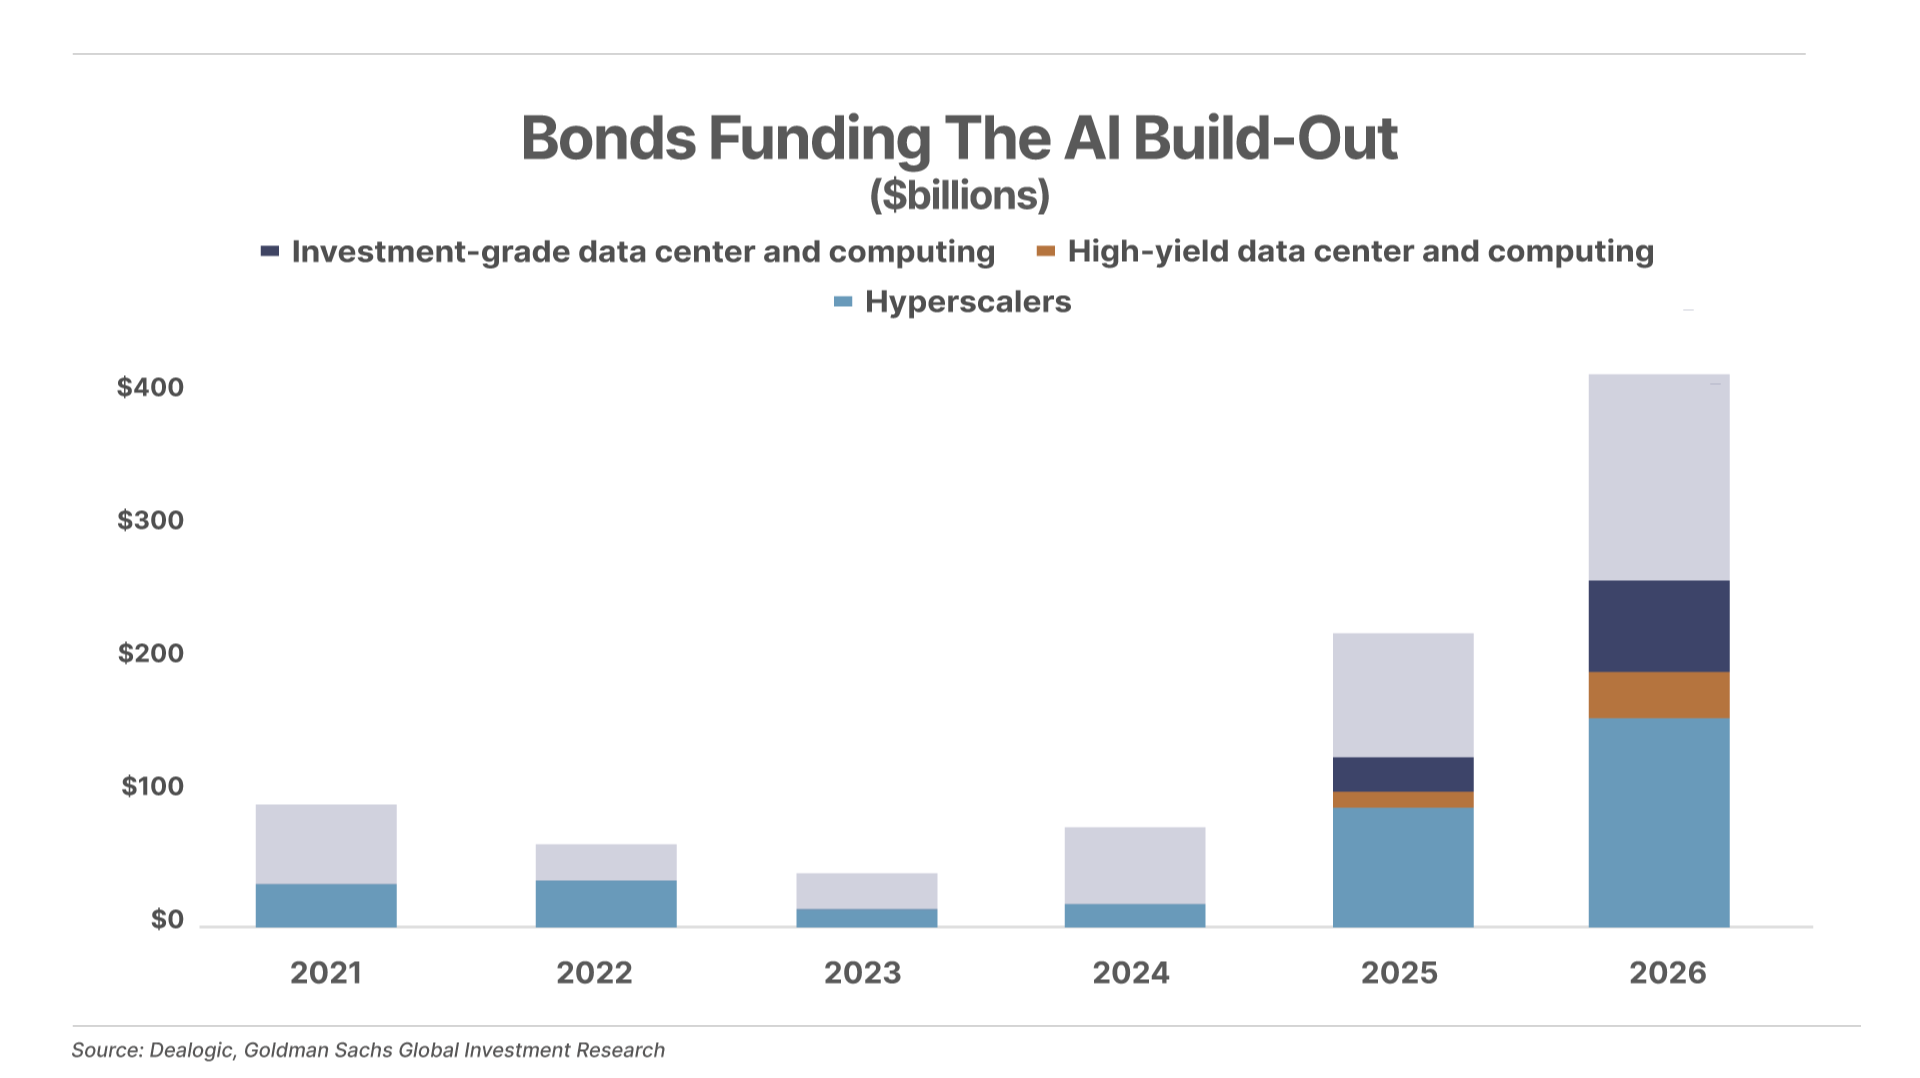
America’s largest technology giants funded the early phases of the AI boom with free cash flow. That’s changing now, with the amount of AI-related debt issuance reaching $419 billion so far in 2026, which already exceeds last year’s total by 90%. All this new debt is becoming a lot more expensive to finance with interest rates on the rise, raising questions about the sustainability of today’s AI infrastructure build out.
Yesterday, Distressed Investing analyst Marty Fridson shared the calamity that took place in the U.S. movie-theater business in the early 2000 when easy money led to overbuilding of movie screens.
Cynthia A. writes:
Great article! It’s clear that the theater business expansion in the 20th century (1990) simply doesn't have a viable business model that works in the 21st century (2026) operating framework. Most brands established in the 19th century and the 20th century are not structured for success in the 21st century. Transformation is not just a word – it's a real thing...
Given the capabilities of digital frameworks, I can envision the theater sector as an all-time digital leader and an example of what successful sustainable digital transformation looks like. But to do this, a new intellectual energy level is needed among 19th- and 20th-century American business leaders in order to lead transformational initiatives and investments of this type.
Bruce M. writes:
I am impressed with the research you folks do.
However, to make the research more accessible and actionable without having to spend a lot of time wading through the many pages, I wish you would provide, for each report, a simple table with the ticker symbol and suggested price for all the buy/sell recommendations in the current report, all on a single page, so the buy/sell recommendations for all investments covered in the report can be reviewed at a glance. In the current format, it's too hard to wade through the verbiage to get to the point!
Please find a spot in the report so that there is a single table showing all recommendations.
Thanks for your consideration.
Porter & Co. Comment: So what your email about “wading through the verbiage” concludes is: Cut to the “Action to Take” line. That way you can skip the impressive “research you folks do.”