Issue #78, Volume #3

Why The Next Crisis From The Persian Gulf Will Be Measured In Bushels, Not Barrels
Inside today's Daily Journal…
|
Editor’s note: Porter’s newest book, 2029: The End of America is moving up the best-sellers list at Amazon. It’s now ranked #11 in its category. If you enjoy Porter’s deeply historical and fact-based analysis of our country’s problems, you’ll love this book. Please get a copy and leave a review.
Everyone is focused on oil, but they should be worried about food.
Global oil inventories fell by 250 million barrels in March and April. JPMorgan warned stockpiles in the wealthy world could drop to "operational stress levels" next month and to an "operational floor level" by September. Oil prices are going to go higher because everyone knows the Persian Gulf is the world's gas station. Most people don’t know it is also the world's chemistry set.
The same petrochemical plants in Qatar, Saudi Arabia, the UAE, Kuwait, and Iran that ship crude oil and liquefied natural gas (“LNG”) also ship out the nitrogen, sulfur, and phosphate inputs that feed roughly half the planet.
The Persian Gulf accounts for at least 20% of global seaborne fertilizer exports. The Middle East supplies 46% of globally traded urea. Iran by itself is the world's second-largest urea exporter. The Strait of Hormuz handles nearly half of global seaborne sulfur trade. It also carries about one-third of seaborne methanol. These Gulf commodities are the primary engine of global food supply.
Natural gas is processed into ammonia. When combined with CO2, it creates urea, the world’s most widely used nitrogen fertilizer for crop growth. Sulfur (a byproduct of gas and oil refining) is converted into sulfuric acid. This acid is the essential solvent used to dissolve phosphate rock to create phosphate fertilizers. Methanol is primarily a fuel, but it also serves as a critical processing agent and precursor for various specialized agricultural chemicals and formaldehyde-based fertilizer coatings that control nutrient release.
In summary, the Gulf provides both the energy (gas) to create nitrogen and the acid (sulfur) to unlock phosphorus – the two critical fertilizers that feed the entire world.
Shipping intelligence firm Kpler reported that fertilizer loadings in the first month of the war fell to roughly 1.5 million metric tons (“mt”), from about 3.4 million in the same period of 2025. That is a 56% drop in one month, on a product that does not store as well as crude oil and does not have a strategic reserve to draw down.
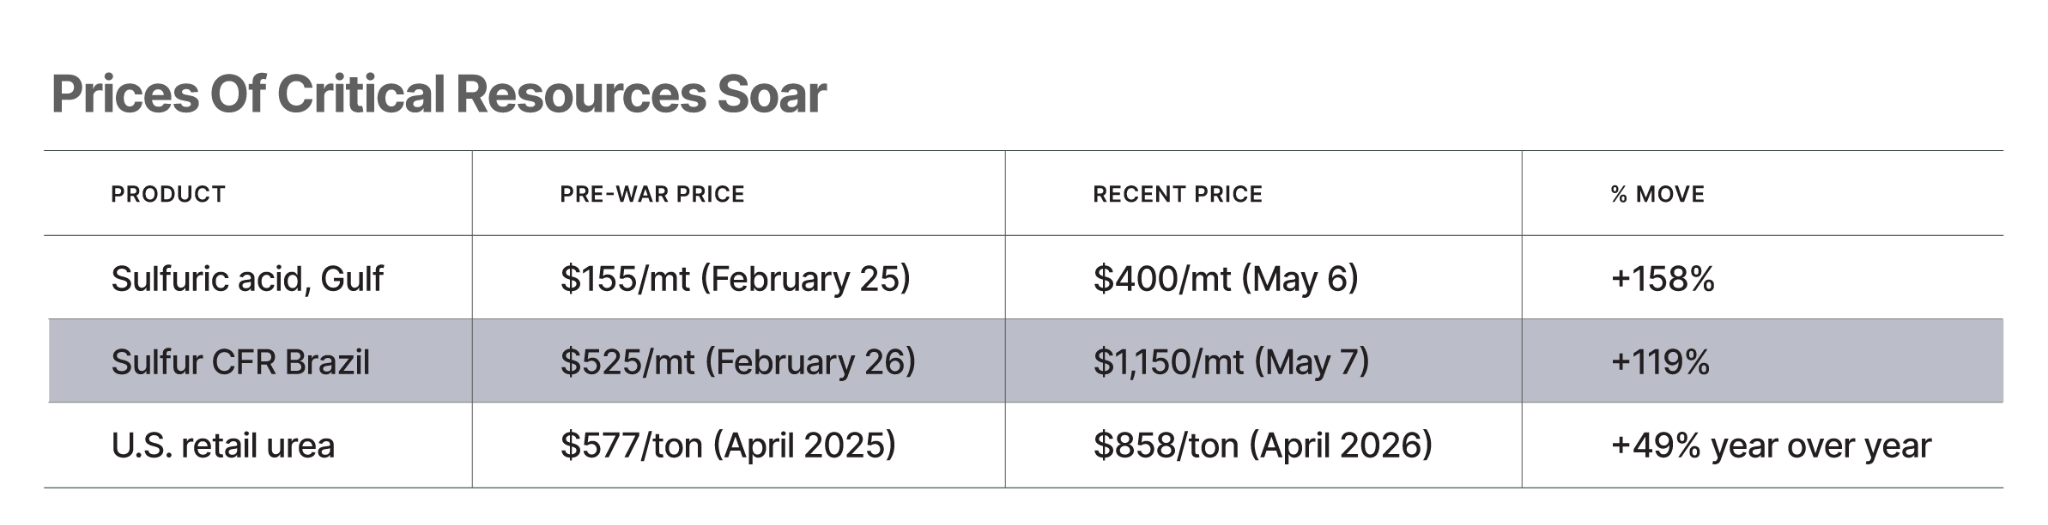
Sulfuric acid is a critical leverage point for the world’s economy. It is the most widely used industrial chemical. It is the feedstock for phosphate fertilizers. You cannot make DAP or MAP without it. DAP is the most widely used phosphorus fertilizer in the world. MAP, the world’s other main fertilizer, is used in areas where alkaline levels are high.
The real crisis – the food crisis – didn’t really begin until May 1. That’s when China, the world's largest exporter of sulfuric acid, banned all sulfuric acid exports.
A lot of poor people are about to starve.
India's exposure, in particular, is terrifying because 80% of India's ammonia comes through the Persian Gulf. India is 60% dependent on imports for its fertilizer needs overall. And India is gearing up for the kharif planting season – rice, cotton, maize – that begins in June with the monsoon.
Bangladesh is the next domino. Bangladesh imports roughly 1.7 million tonnes of urea, 700,000 tonnes of TSP, 1.5 million tonnes of DAP, and 1.2 million tonnes of MOP (muriate of potash) a year — and the USDA describes its DAP and MOP markets as "fully" or "mostly" import-dependent. The country's 170 million people get their rice from this imported fertilizer.
A 28% urea price increase in three weeks doesn't matter much to a Maryland soybean farmer hedging on the Chicago Board Of Trade (“CBOT”) futures exchange. It is a different sentence when 60% of your country's fertilizer is imported, 80% of your ammonia comes through the Strait of Hormuz, your harvest is single-cycle and rain-fed, and your purchasing power is already gutted. And there’s no diesel, either.
If urea and DAP are not on the docks in Mumbai, Chittagong, and Karachi by mid-June, the yield damage is locked in for this crop year. The famine would hit Southeast Asia by the end of the year.
We already know what will happen because, in April 2021, the Rajapaksa government of Sri Lanka banned chemical fertilizer imports. The government intended to make the country the world's first 100% organic farming nation. The country went from being a rice exporter to importing 783,420 tonnes of rice at the peak of the crisis at a cost of $292.5 million – its first large-scale rice imports in decades. Sri Lankan rice output has still not returned to its pre-ban peak of 3 million metric tons. The food inflation that followed contributed to the country's worst economic crisis in over 70 years.
That was one country that went seven months without global fertilizer. It is hard to imagine what will happen to the people of Southeast Asia if the Persian Gulf isn’t completely re-opened in the next month.
And rising food prices won’t only be a problem in Asia.
Wheat, like all cereal grains, is a nitrogen-hungry crop. The single largest variable cost in growing wheat is fertilizer, and the single largest component of fertilizer cost is nitrogen. When urea doubles, the cost to grow next year's crop goes up 25%–35%, depending on the producer's contract structure. On Wednesday, U.S. wheat futures jumped 4.1% in a single session to close at $6.58 a bushel. Year-to-date, wheat is up roughly 30%. The breakout on the chart is the kind of base breakout any seasoned commodity trader would recognize as the start of a major move.
Because of an early heat dome across Kansas, Oklahoma, and the Texas panhandle, 34% of the winter wheat crop is already forming grain heads. This means that the crop is maturing two to three weeks early. Wheat plants that "head out" early produce smaller kernels, less starch, lower test weights, and dramatically lower yields per acre. But that’s not the real problem. The real problem is that American farmers planted the smallest wheat acreage since 1919.
Not since World War I, not since cars began to outnumber horses, has the United States, the world's breadbasket, planted this little wheat. We are growing the smallest crop in 107 years, on the worst-rated acreage in a decade, in the middle of a Plains drought.
U.S. farmers didn't plant less wheat because they wanted to. They planted less wheat because they couldn't afford to plant it. The total cost per acre (seed, DAP, diesel, crop insurance premiums, equipment, labor, repairs, hauling, storage) to grow a wheat crop is roughly $685. The breakeven price for wheat, on a typical 45-bushel-per-acre Kansas yield, is therefore $15.20 a bushel. But wheat closed Wednesday at $6.58.
The American wheat farmer has been losing money on every acre for three straight years, even with crop-insurance subsidies and disaster payments propping up the income statement. Now the bank loans are coming due, the land is being foreclosed, and the equipment is being repossessed. U.S. farm bankruptcies are up 46% year-over-year (“YOY”), the steepest jump since the 2008-2010 collapse and the second-steepest in 40 years. Chapter 12 filings – the bankruptcy code provision specifically designed for family farmers – accelerated again in Q1 2026. Every farm that goes under takes acreage off the board. Sometimes permanently. Because the consolidation buyers are corporate operators who plant corn and soybeans (more profitable, easier to mechanize) instead of wheat.
This is how a supply shock builds. Not in a single bad-weather event. But in a multi-year squeeze where the marginal producer is wiped out one season at a time, until the only ones left can charge whatever the market will bear.
As supplies of food and other commodities tighten, prices will rise – far more than anyone expects. The U.S. Producer Price Index (“PPI”) is up 6% YOY already. Those increases will filter into consumer prices over the next 90 days, and they will keep rising. We’re facing the kind of inflationary shock we haven’t seen since the 1970s with a bond market that’s still pricing in inflation rates below 3% for the next decade.
War isn’t good for bonds. And there’s an entire generation of Americans who haven’t ever seen anything like what’s about to happen to the fixed-income markets. If the Gulf remains closed through the end of June, I think we’ll see 10-year yields above 6% – and rising. That’s not on anyone’s bond-market bingo card today.
In 2022, the bond market experienced a 237-basis point rise in 10-year yields as the massive COVID inflation was priced into the bond market. That produced a 13% loss in the investment-grade fixed-income markets (Bloomberg U.S. Aggregate Fixed Income Index). That was the worst year in the history (1976) of the index and wiped out $3.4 trillion in capital. That index doesn’t include high-yield bonds or muni bonds. If you include the losses in that part of the bond market, the total losses exceeded $4 trillion.
But as you probably know, there’s been a massive debt issuance boom. The bond market is now much larger than it was in 2022. Today a 150-basis point move higher in the 10-year Treasury yield (from 4.5% to 6.0%) would see losses of around $3 trillion in Treasuries, over $1 trillion in agency mortgage bonds, and over $1.2 trillion in investment-grade corporate bonds… plus another $1 trillion in everything else… for around $7 trillion in losses.
Long-term rates over 6% would push margin rates at brokerage firms to 10% or more. How much of the $1.3 trillion in margin debt would remain outstanding at those rates? Not much.
We’re heading into a huge crisis for the world and for our bond markets with a government that doesn’t seem to want an off ramp. Meanwhile, the stock market is trading at all-time, peak bubble levels. This is, without a doubt, the worst risk-to-reward set up I have ever seen in the stock market across my entire 30-year career. If there’s a happy ending here for investors, it will be a miracle.
How to hedge against these risks? Own the businesses that can convert cheap American energy into everything the world is now short. I’ve talked about many of these businesses before and they’ve all recently increased their profit forecasts, dramatically.
#1. Venture Global (VG) – a 52% increase to 2026 EBITDA guidance. Operates Calcasieu Pass and Plaquemines LNG export terminals, taking Henry Hub gas and selling cargos at international prices. Q1 revenue $4.6 billion (up 59% YoY), 130 cargos (up 111% YoY), 481 trillion British thermal units sold.
# 2. CF Industries (CF) – 64% YOY Q1 adjusted EBITDA. Largest North American nitrogen fertilizer producer. Takes Henry Hub gas, makes ammonia/urea/UAN, captures global nitrogen prices.
#3. ExxonMobil (XOM) – America’s leading integrated energy producer and the leading Permian Basin operator. Has the single largest opportunity to reap the rewards of huge global price increases. Analysts expect ExxonMobil's 2026 earnings per share to grow 64% to 71% YOY, driven by the Hormuz-disrupted global pricing on every commodity Exxon sells. XOM was our first Complete Investor recommendation this year and our best idea from our “long energy” call for 2026.
#4. Targa Resources (TRGP) – 5.5% to 2026 EBITDA guidance midpoint. Permian-focused natural-gas liquids (“NGL”) producer-exporter. Fractionates at Mont Belvieu (Cedar Bayou complex in Texas), exports liquefied petroleum gas (“LPG”) through Galena Park on the Houston Ship Channel. Owns the molecules – does not just transport them.
Tell me what you think of today’s Journal: porterstansberrydirect@gmail.com
Good investing,
Porter Stansberry
Stevenson, Maryland
I invited Distressed Investing analysts Marty Fridson and Andrew Lipman, Tech Frontiers’ Erez Kalir, Trading Club’s Ross Hendricks, and Justin Brill (who shares details of a new Porter & Co. advisory) to join me for an urgent summit called The Final Melt-Up where we explored the state of the markets in much greater detail – and we all joined forces to lay out a step-by-step plan for navigating these treacherous times.
This all-hands broadcast was just released yesterday and if you haven’t watched it yet, please go here now because this may be one of the most important events we’ve ever organized and I was thrilled to be a part of it.
Together, the entire team joins Porter to lay out exactly how to both safeguard your wealth and grow it during this Final Melt-Up.

3 Things To Know Before We Go…
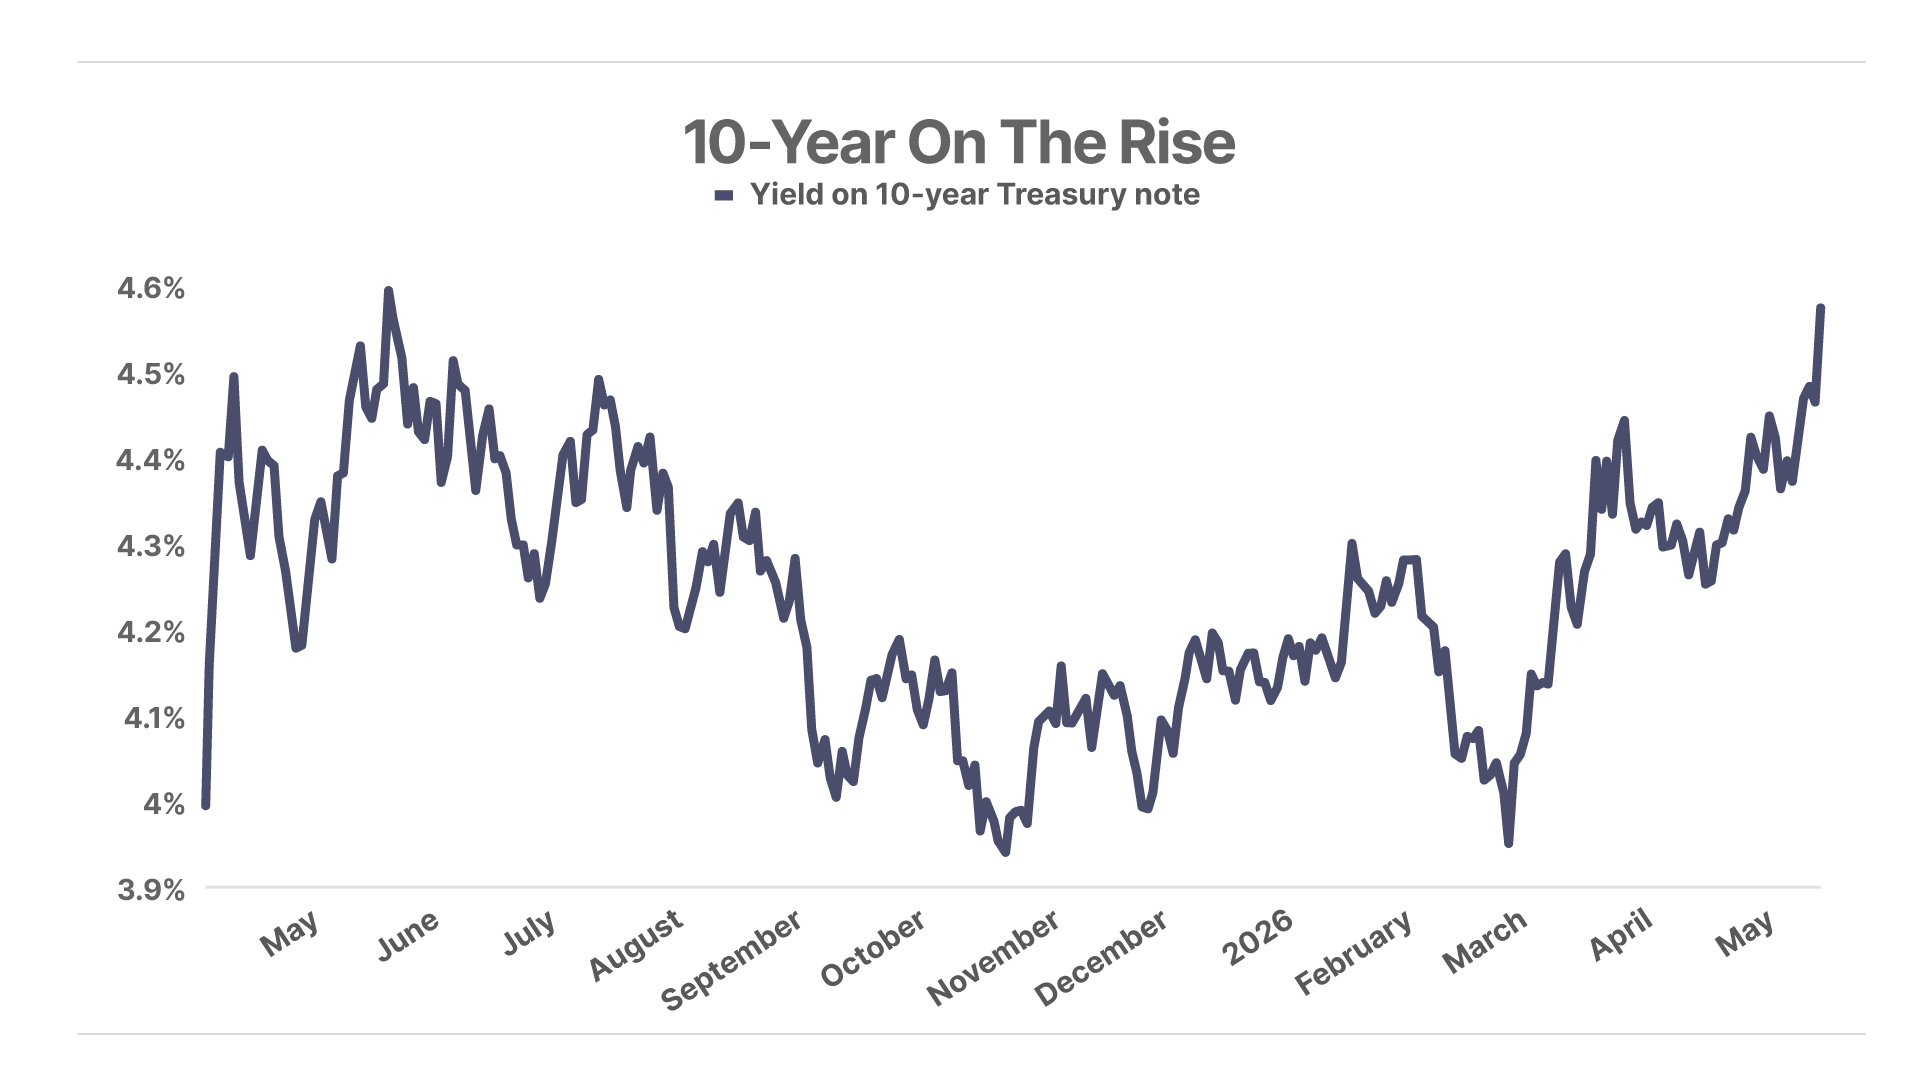
1. The 10-year Treasury yield pushed back above 4.5% this morning. Just as Porter predicted earlier this week, the benchmark climbed to 4.58%, its highest level in nearly a year, after the April consumer price index (“CPI”) recorded its largest increase since 2023. We're now within striking distance of the 5% "out of the pool" level where Porter has warned he will recommend selling stocks to raise cash. However, the 4.5% threshold has triggered two White House interventions over the past 13 months – so don’t be surprised if the Trump administration attempts to talk rates down again with some positive headlines over the weekend.
2. South Korea's KOSPI Index plunged 6% after touching 8,000 for the first time. Samsung Electronics, which together with SK Hynix accounts for 42% of the index, crashed nearly 9% as the company’s labor union announced an 18-day, 45,000-worker strike starting May 21. Chinese President Xi warned U.S. President Trump at the Beijing summit that Taiwan could push the two countries into "conflict,” and the KOSPI's P/E reached an historically rich 30 after an 80%-plus year-to-date rally.
3. The UAE looks to bypass Hormuz. Abu Dhabi National Oil is accelerating a second pipeline to the Gulf of Oman, supplementing its existing 1.5 million barrel per day line that has kept UAE crude moving since Iran shut the Strait of Hormuz in late February. This new capacity won't arrive in time to ease the current supply disruption, but it permanently shrinks Iran's leverage in the next standoff – and, with Saudi Arabia expanding its Red Sea pipeline in parallel, it signals that the Persian Gulf's biggest producers are quietly removing the Strait as a geopolitical weapon.
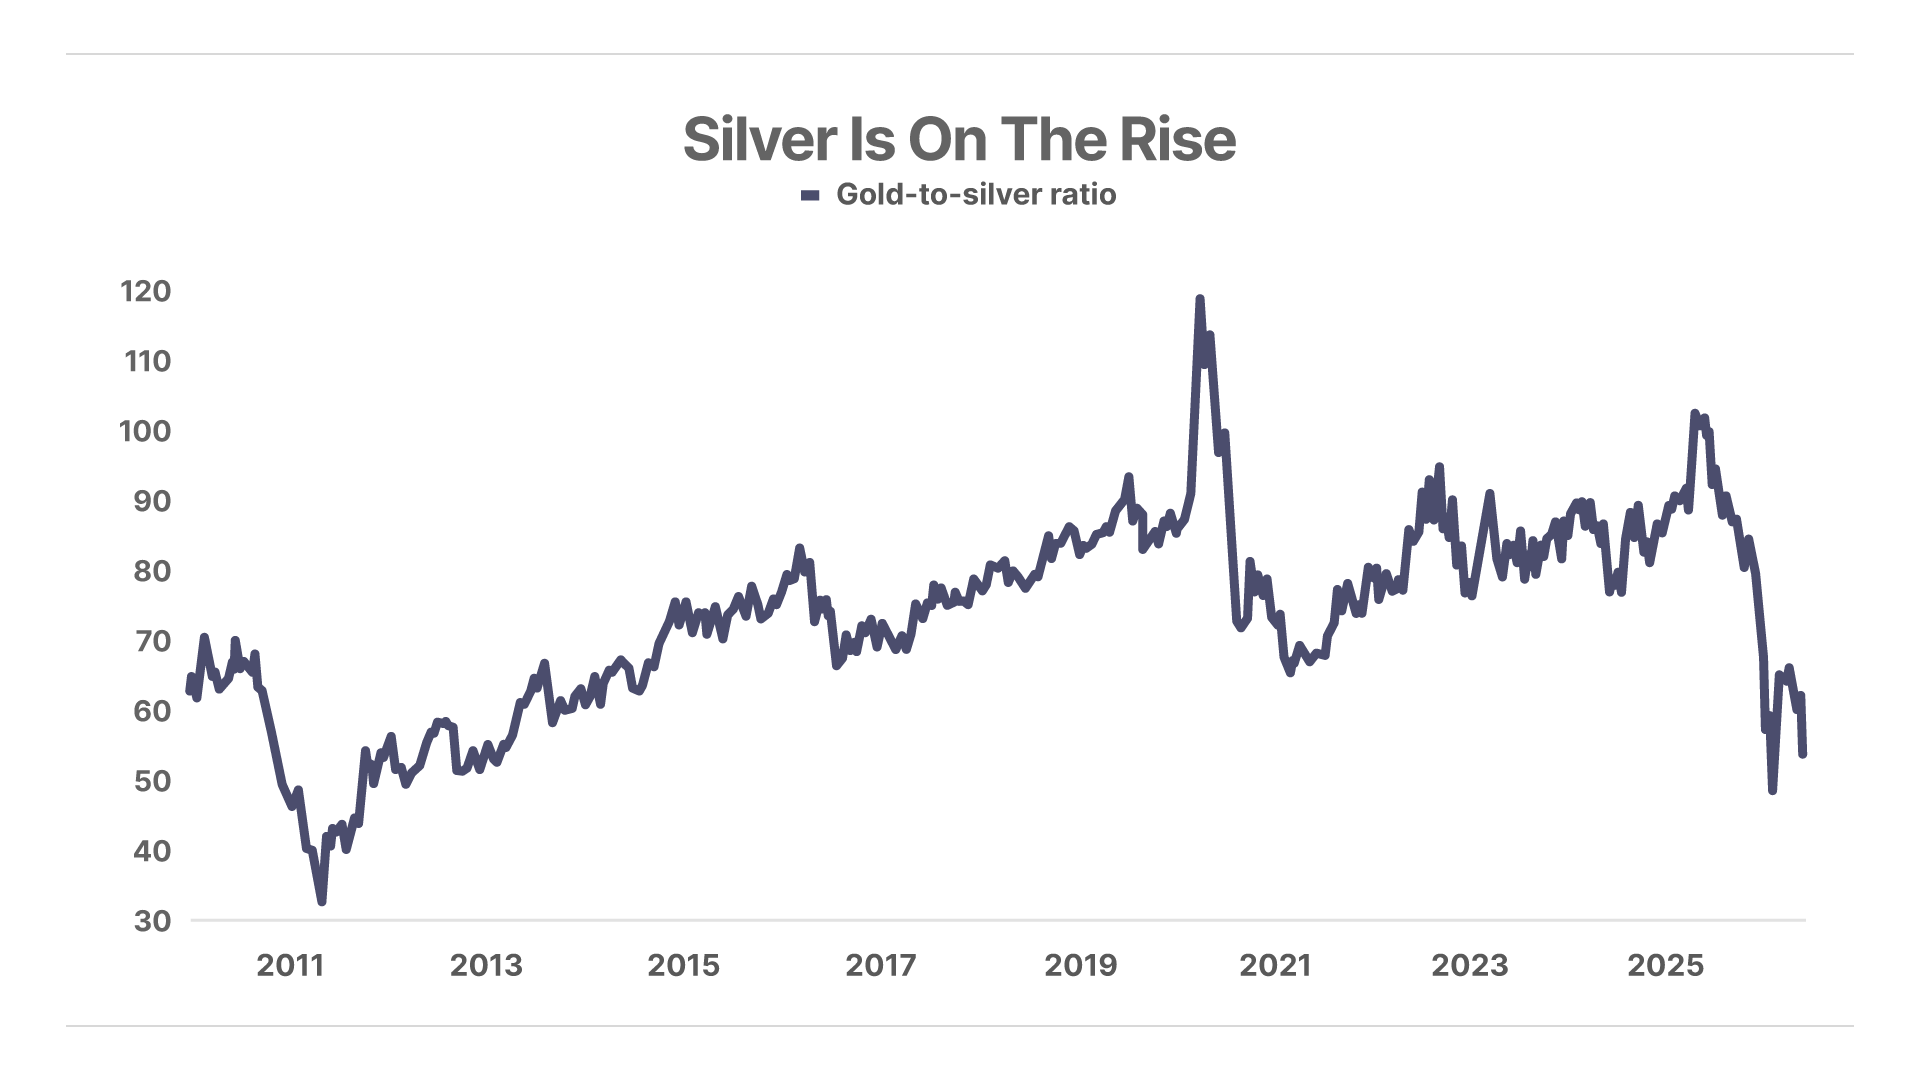
Chart Of The Day… Silver Gains Momentum
The gold-to-silver ratio fell to 54 in May – the second-lowest reading since February 2023. With silver up 20% to $87 per ounce while gold lags, the market is pricing in a widening structural deficit fueled by industrial demand for solar, electric vehicles, and AI semiconductors. The ratio has now fallen nearly 49% from its 2025 peak, signaling that silver is reclaiming its role as a leader in precious metals.
Mailbag
“Comparing Time”
Phillip B. writes:
You have been comparing our current situation to just before 2000, but I started looking at it from the Reagan years. We had just gotten through a weak foreign-policy President and high inflation. The Reagan administration came in and started to cut regulations and taxes. We had about 18 months of iffy market, then it started taking off. I see the same thing now. Trump started out cutting back regulations that had a throttling effect, got through tax cuts and, whether you agree with his foreign policy or not, you can't deny that he isn't much more aggressive than Biden. So we had a slow start at first, then things started kicking in. The difference I see is that Reagan's market took longer to get robust. Obviously, I don't have the research capability like you, but it's something I see that is similar. We were up quite a bit at the end of it all, maybe history will rhyme.
“Gold Counsel”
Robert S. writes:
Porter,
Thank you for your very insightful analysis. I am a Lifetime Member of Porter & Co. and also at Stansberry.
I read the statement in your recent Daily Journal about "gold tends to lag on the way up, and lead on the way down," except this time, gold is hitting all-time highs while Bitcoin is falling.”
My question is – I have lots of gold equities. In this circumstance, should people cash them in and take cover in short-term T-bill-type debt until they have gone down during the general liquidation as a place that people can get capital in the storm? Or since they have gone up during the lead-up to this, should people continue to hold them?
Porter Comment: Gold is well above my model’s forecast range, currently. It’s had a huge move up. I expect its current correction will continue this year. But I can’t offer you any sensible advice about your gold stocks – I don’t know what you own, I don’t know the tax consequences of selling, and I don’t know how they fit into your portfolio or your strategy. (Also, it is against SEC regulations for me to offer anyone any specific advice about their holdings. We offer investment research to the public at-large, not to any individual.)
“2029: The End Of America”
Leslie V. writes:
Hi Porter,
I have just finished reading your latest book: 2029: The End of America, which both scared me a little and encouraged me a great deal. In the chapter relating to long-term investing in lumber, you didn’t specify any particular stocks you thought would be good candidates to buy, something you did for gold investing. Is there a reason for this?
Porter Comment: Is this a joke? Chapter 8 is the entire history of investing in timber. It discusses all of the publicly traded timber stocks and details a trading strategy that has produced 20% annual gains. How did you miss that, I wonder? In fact, I think Chapter 8 is the single best solution for dealing with this very risky market. I hope you’ll read it.
Porter & Co. Market Snapshot
| Price | Yesterday's Return | Year-to-Date Return | |
|---|---|---|---|
| S&P 500 Index | $7,501.24 | 0.77% | 9.58% |
| Gold per ounce | $4,678.10 | -0.85% | 5.50% |
| Bitcoin | $81,395 | 2.16% | -8.6% |
| Oil (West Texas Intermediate) per barrel | $101.17 | 0.15% | 81.7% |
| Berkshire Hathaway (BRK) | $727,180.05 | -0.04% | -3.66% |
| Porter's Permanent Portfolio | - | -0.47% | -0.1% |
| The Better Than Berkshire Index | - | -0.45% | 0.4% |
| Total Return | Annual Return | ||
| Porter & Co's Top Ranked* | 33% | 14.3% | |
| Yield | Yesterday's Change | Change Year-to-Date |
|
| U.S Treasury 30-Year Yield | 5.03% | -1 bps | 18 bps |
*A Complete Investor risk rating of 1 is defined as a "low risk, high allocation" security, while positions rated closer to a 5 are higher risk. Porter & Co.'s top-ranked positions include those rated either 1 or 2 in Complete Investor portfolio.
Porter & Co. Top Positions
| Publication | Ticker | Description | Total Return |
|---|---|---|---|
| Complete Investor | BWXT | BWX Technologies | 269% |
| Tech Frontiers | QURE | uniQure | 237% |
| Complete Investor | BTC/USD | Bitcoin | 200% |
| Tech Frontiers | SGMT | Sagimet Biosciences | 137% |
| Complete Investor | PM | Philip Morris | 136% |
| Tech Frontiers | QURE | uniQure | 131% |
| Tech Frontiers | ROIV | Roivant Sciences | 131% |
| Tech Frontiers | TGTX | TG Therapeutics | 117% |
| Distressed Investing | HLF | Herbalife | 102% |
| Distressed Investing | PTON | Peloton Interactive | 97% |
Prices as of 4:00 pm ET May 14, 2026
Please note: The investments in our “Porter & Co. Top Positions” should not be considered current recommendations. These positions are the best performers across our publications – and the securities listed may (or may not) be above the current buy-up-to price. To learn more, visit the current recommendations page of the relevant service, here. To gain access or to learn more about our current recommendations, call our Customer Care team at 888-610-8895 or internationally at +1 443-815-4447.