Issue #82, Volume #3


How Disparate Impact Destroyed U.S. Cities
Inside today's Daily Journal…
|
Editor’s Note: Last month Porter published a book that is sure to become one of the most controversial titles of the year – 2029: The End of America. Among the leading foundational causes for America’s descent into cultural chaos is the legal theory of “disparate impact.” Codified into law by the 1991 Civil Rights Act, the law has been used to destroy public education, by demanding that all students receive the same grades – even when they’re failing. But the greatest damage to our society has been the law’s application to public safety. Below you’ll find something you’re not allowed to say in America today: black people, in aggregate, are very dangerous.
In 2023, the Bureau of Justice Statistics reported that black Americans, who make up roughly 13% of the U.S. population, were the victims of homicide at a rate of 21.3 per 100,000.
That is more than six times the rate for white Americans. The FBI’s Supplementary Homicide Reports show that black Americans account for roughly half of all known homicide offenders in the United States, across every year for which data are available.
These are not controversial numbers. They are the official numbers.
They describe a concentration of violent crime so intense that a child born today in certain neighborhoods of Baltimore, Chicago, or St. Louis faces a statistical lifetime risk of homicide comparable to that of a soldier in active combat.
Demographers will tell you that black people, all around the world and in America both before and after the Civil Rights Act, are more violent than other races. Merely writing that is considered racist today, as if facts, by themselves, could possibly be prejudiced.
Consider the cross-national evidence first, because the cross-national evidence is the hardest for black apologists to explain away.
The United Nations Office on Drugs and Crime has published comparable international homicide statistics for more than 20 years. The countries at the top of the global homicide rankings – year after year, decade after decade – are the countries of sub-Saharan Africa, the Caribbean, and the African-descended population centers of Central and South America: El Salvador, Honduras, Jamaica, South Africa, the Bahamas, Belize, Venezuela, and Brazil. The countries at the bottom of the rankings are the ethnically homogeneous nations of East Asia and Northern Europe – Japan, Singapore, South Korea, Norway, and Switzerland.
This pattern is not explained by American slavery, because most of these countries were never involved in American slavery. It is not explained by American segregation, because most of these countries were never involved in American segregation. It is not explained by the American welfare state, because most of these countries have no meaningful welfare state. It is not explained by the Ferguson Effect, the 1994 crime bill, redlining, the Moynihan Report, Jim Crow, or any of the other American-specific causes that black political activists invoke whenever the American numbers are discussed.
Consider the historical evidence next. The homicide rate among free black Americans in the antebellum North – documented in the court records of Philadelphia, New York, and Boston across the 1830s and 1840s by the historian Roger Lane and others – was already multiples higher than the rate among whites in the same cities. This was two decades before Emancipation. It was a century before the Great Migration. It was a century and a half before the welfare state the criminologists blame.
The pattern was there in 1840. It was there in 1890 and 1920 and 1950. It has been there in every decade for which we have records, at something like its current ratio.
Harvard sociologist Orlando Patterson, himself a black Jamaican, has made this point in print for 40 years. He has been ignored for 40 years even though Patterson cannot be dismissed as a racist.
Consider the controlled evidence last. When researchers compare homicide rates within racial groups by socioeconomic status – poor whites versus poor blacks in comparable neighborhoods, middle-class whites versus middle-class blacks in comparable neighborhoods – the racial gap narrows but does not close. Wealthy black people kill at a rate that’s higher than poor white people.
Poverty matters. Family structure matters. Fatherlessness matters. But after every control the criminologists can throw at the data, a residual gap remains, and the residual gap is not small. It is obvious and has been in the data since such statistics have been kept.
Now set that evidence beside the criminologists’ standard explanation. The criminologists will tell you that the legacy of the welfare-state destruction of the black family, combined with the collapse of black education, combined with the flight of legitimate employers from the inner city, combined with 50 years of progressive prosecution policies that refuse to incapacitate repeat violent offenders, has produced the environment in which the violence occurs.
Every element of the criminologists’ story is true, too. The black family was destroyed by the welfare state. Black education did collapse. Legitimate employers did flee. Progressive prosecutors do refuse to incapacitate violent offenders. Each of those factors raises the homicide rate, in any population subjected to it, by a measurable amount.
But none of those factors, singly or together, explains the cross-national evidence or the antebellum evidence or the within-group residual.
You can subtract every American-specific factor the criminologists name, and you still have Jamaica and Honduras and the Bahamas at the top of the homicide tables. You still have free black people in the 1840s showing higher rates of homicide. You still have the residual gap in the multivariate regressions. The criminologists’ explanations are not wrong. They are insufficient. A 2011 paper by the behavioral geneticists J. Philippe Rushton and Arthur Jensen – scholars pilloried in their lifetimes and still pilloried now – argued that the cross-cultural persistence of the pattern pointed to something deeper than environment.
Here is what I have come to believe after 30 years of reading the data honestly. The honest answer is that we do not fully understand why the disparity exists and has continued to exist for centuries. The disparity has cultural components and historical components and, yes, almost certainly some biological components that America’s political and academic establishment resolutely continues to ignore.
But it does not matter whether the cause of the disparity is genetic or cultural or historical or some combination of all three. It does not matter whether it is 100% environmental or 50% or 10%. It does not matter whether Rushton was right or the criminologists were right or the truth lies somewhere neither side will publish.
What matters, for the purposes of governing a country and protecting its citizens, is that black Americans commit homicide at roughly eight times the rate of white Americans. And black Americans are the victims of homicide at roughly six times the rate of white Americans. This has been true in every decade for which we have records.
A republic cannot govern itself by pretending that facts it finds uncomfortable do not exist.
The criminologists’ explanations may be right, partially right, or wrong – it does not change what has to be done. What has to be done is the same thing any functioning society does with its most violent offenders, of any race, in any era: identify them, arrest them, convict them, and incarcerate them until they are no longer a threat to their neighbors.
We are the wealthiest, most powerful nation in the world. We absolutely have the ability to punish violent criminals, of any race, and to make sure they never hurt anyone, ever again.
The doctrine of disparate impact has made it an impossible job, because the doctrine holds that the pattern of who gets arrested is itself evidence of injustice, regardless of the underlying pattern of who commits the offenses. Under the doctrine, a police force that correctly identifies the offenders in its jurisdiction – and therefore produces arrest statistics that reflect the offending statistics – is, by that very fact, guilty of racial discrimination.
So the police stop correctly identifying the offenders. And the offenders, no longer arrested, go on to kill more people. And the additional people they kill are, in overwhelming majority, black – because the offenders live among their victims, and their victims are their neighbors. The doctrine, sold as a protection for black Americans, has produced a policing regime that leaves black Americans unprotected from the offenders in their midst.
The doctrine is almost as much at fault as the killer.
The criminologists and the demographers can continue their argument about the underlying causes of the violence for the next hundred years. While they argue, the bodies accumulate, and the bodies are disproportionately black.
Put violent people in prison. Keep them there. That is the beginning and end of the argument. Whatever the cause – cultural, historical, biological, environmental, or the inscrutable tangle of all of them – a functional society must remove violent offenders from the society they are victimizing.
But in the second term of the Obama administration, the Department of Justice launched the most aggressive campaign of federal intervention in American policing in the nation’s history – not to stop the killing, but to stop the arresting.
Between 2009 and 2017, the Obama Department of Justice entered 15 consent decrees with American police departments. That is five times the number the Bush administration had entered in the preceding eight years.
The decrees followed a standardized template. A federal pattern-or-practice investigation would be opened after a high-profile incident. The investigation would document statistical disparities in stops, arrests, and use of force. The department would be presented with a choice: accept federal supervision under a consent decree, or fight the Justice Department in court with city taxpayer money, for years, and lose. Every major American police department chose the consent decree.
The decrees mandated the predictable things. Use-of-force reporting. Body cameras. Implicit-bias training. Civilian oversight. Reductions in stop-and-frisk. Reductions in discretionary arrests. Every item on the list, considered in isolation, sounded reasonable. Considered as a system, the list amounted to a transfer of policing authority from the officers on the street to the federal monitors overseeing the decree – monitors who were themselves lawyers trained in the doctrine, monitors whose professional advancement depended on producing reports showing that policing disparities had been reduced.
And in every city that went under a consent decree, the same pattern emerged. Police officers, trained in the new regime, learned to avoid interactions with the highest-crime populations. Not out of racism, but out of career self-preservation. A stop that produced a disparity could end an officer’s career. A stop that did not happen could not. So the stops did not happen. The arrests did not happen. The proactive policing that had produced the great American crime decline of the 1990s – the stop-and-frisks, the broken-windows enforcement, the quality-of-life arrests – simply stopped being done.
And then, in August 2014, 18-year-old Michael Brown was shot by a police officer in Ferguson, Missouri, after Brown – having just robbed a convenience store – attempted to take the officer’s weapon. The Department of Justice, under Eric Holder, launched a six-month investigation that ultimately exonerated the officer of all wrongdoing and confirmed, in detail, that Brown had attacked the officer and attempted to seize his service weapon. But by the time the report was released, the narrative had solidified. Hands up, don’t shoot – a phrase that, according to the DOJ’s own investigation, had never been uttered – became the rallying cry of a national movement. Ferguson became shorthand for everything the doctrine said about American policing.
And the American murder rate began to rise.
From 2014 to 2016, the homicide rate in the United States increased by about 20%. Law-enforcement professionals and serious criminologists pointed to what Manhattan Institute scholar Heather Mac Donald named the Ferguson Effect – a measurable pullback in proactive policing, especially in high-crime neighborhoods, as officers learned that discretionary stops could end their careers. The academic establishment denied the effect existed. Subsequent peer-reviewed studies, published years later, confirmed Mac Donald had been right all along. In the immediate aftermath of Michael Brown’s death in Ferguson itself, self-initiated arrests by police officers fell 62%. Foot patrol fell 82%. Pedestrian checks fell 76%. The decline persisted for years. Violent crime in Ferguson rose accordingly.
That was the warm-up. In May 2020, after the death of George Floyd in Minneapolis, the Ferguson Effect of 2014 to 2016 recurred at national scale, but with the accelerant of a sympathetic political establishment, a sympathetic media, and a complicit municipal leadership. In 2020, the American homicide rate rose almost 30% in a single year. That is the largest single-year increase ever recorded in the United States of America – larger than the increase in 1968, larger than the increase after the 9/11 attacks, larger than any year during the 1960s or the 1970s or the crack epidemic of the early 1990s.
Roughly 5,000 more Americans were murdered in 2020 than in 2019. The overwhelming majority of the additional victims were black.
Let me sharpen the point. The doctrine that began as a promise to protect black Americans from discriminatory policing produced – when applied at scale – a policing regime that resulted in thousands of additional black Americans being murdered every year by their fellow citizens. The protective doctrine was the murderous doctrine. Every additional corpse laid at the doorstep of a policy that said the arrest statistics, rather than the homicide statistics, were the measure of racial justice.
And the cities it happened in were no accident. St. Louis. Baltimore. Chicago. Detroit. Oakland. Philadelphia. Memphis. New Orleans. The cities that had spent the last two decades electing reform prosecutors, defunding their police, releasing repeat violent offenders on cashless bail, and refusing to prosecute shoplifting under the theory that enforcement produced a disparate impact. Every one of those cities is now a case study in what happens when you apply the doctrine to the basic municipal functions of law and order.
You cannot live in downtown St. Louis. You cannot walk home at night in downtown Baltimore. You cannot leave your car unlocked in downtown San Francisco. Walgreens and CVS have closed hundreds of stores in American cities – not because the stores are unprofitable in the abstract, but because the stores cannot function in cities where shoplifting has been decriminalized and security guards who intervene face prosecution themselves. Target closes stores. Whole Foods closes stores. The grocery store closes, and then the dry cleaner closes, and then the laundromat closes, and then the pharmacy closes, and the neighborhood that depended on them is reduced to a food desert policed by no one and abandoned by the commerce that once made it habitable.
This is not a partisan observation. This is what the empirical data show. The doctrine of disparate impact, applied to policing, produced cities where the poor – and particularly the black poor – are worse off than they were before the doctrine arrived.
This is Marxism by another name. The doctrine promised protection. It delivered abandonment. And a generation of urban Americans are now living, as of 2026, in communities more dangerous than any American communities have been since the early 1970s.
2029: The End of America is available now at Amazon.com
Tell me what you think of today’s Journal: porterstansberrydirect@gmail.com
Good investing,
Porter Stansberry
Stevenson, Maryland

3 Things To Know Before We Go…
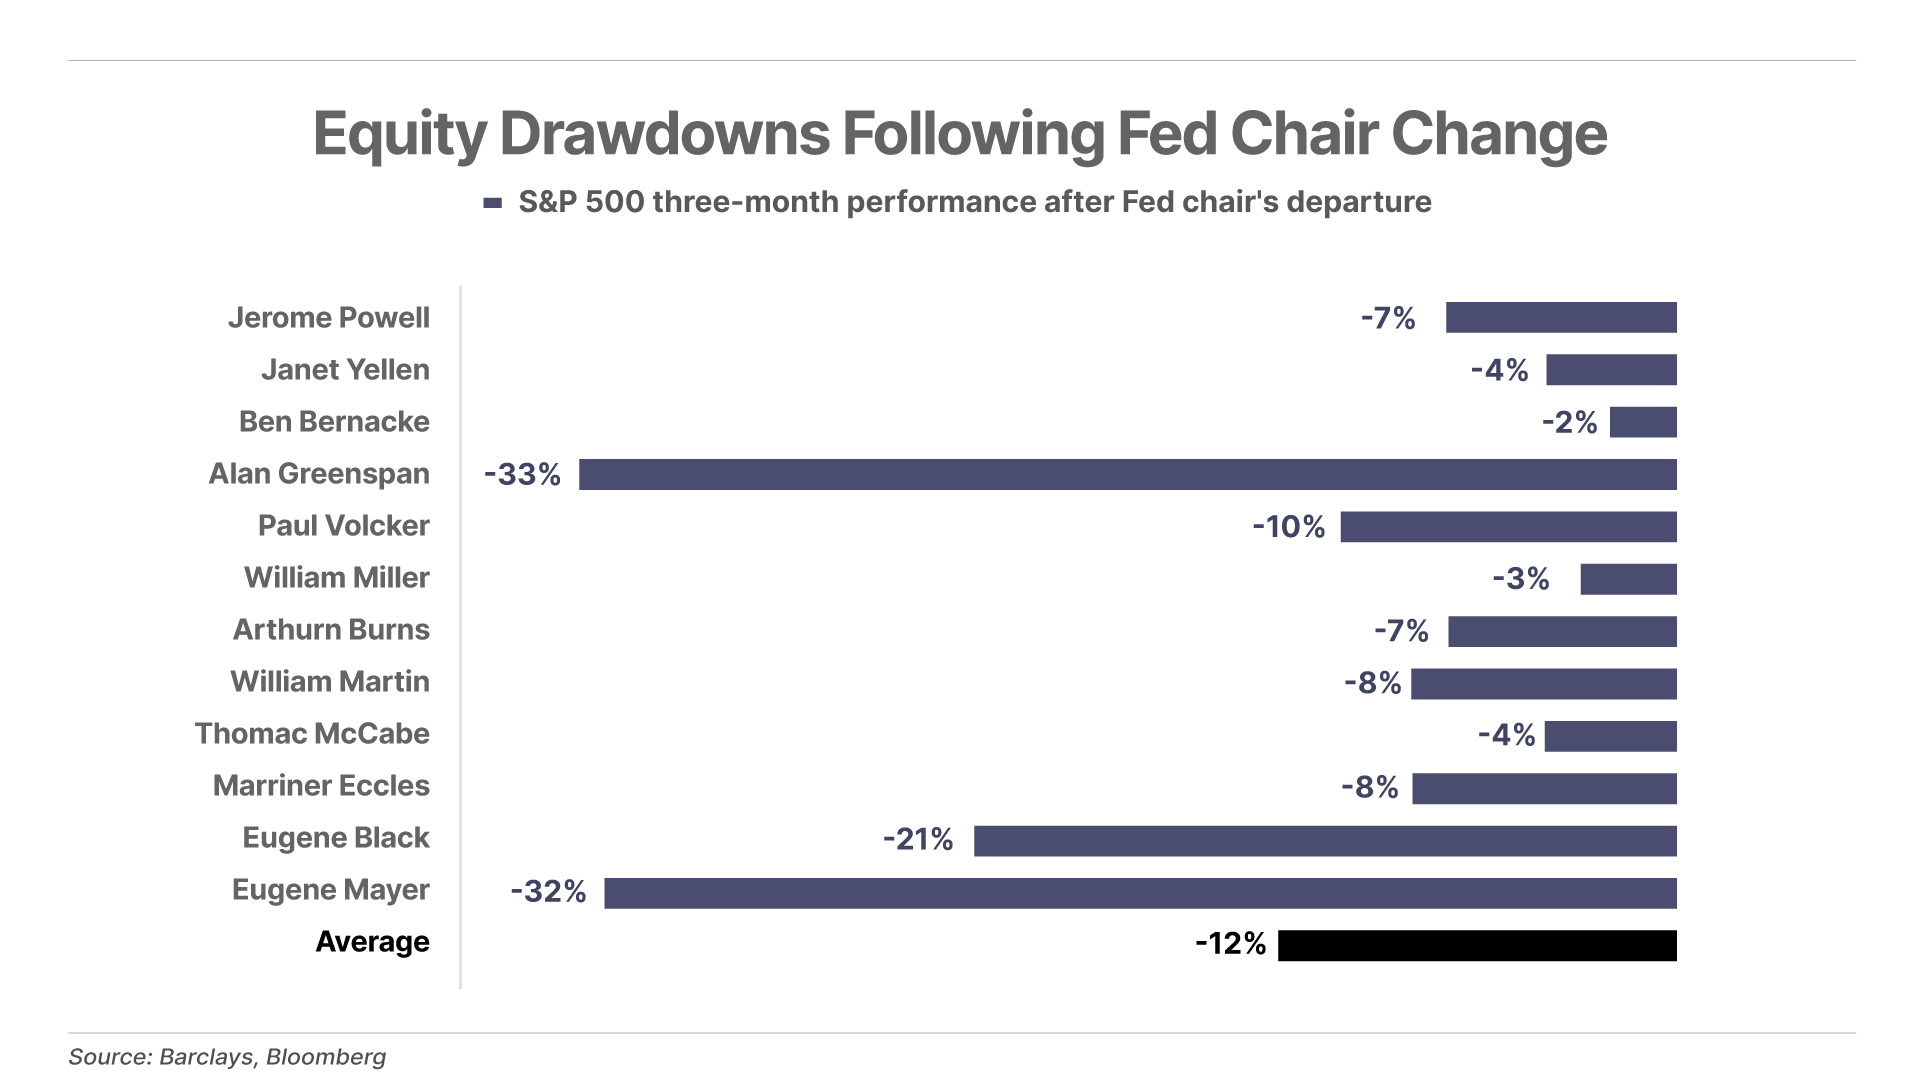
1. The bearish history of new Fed chairs. With new Federal Reserve Chair Kevin Warsh set to be sworn in tomorrow, it’s worth noting that the S&P 500 has experienced a drawdown in the first three months following every change in Fed chairs dating back to at least 1930. The average three-month decline has been -12% – however, the individual drawdowns have varied significantly, from as much as -33% after Alan Greenspan took the helm in August 1987 to as little as -2% after Ben Bernanke was confirmed in February 2006.
2. The White House makes a massive quantum computing bet. In exchange for equity, the Trump administration is deploying $2 billion from the Biden-era CHIPS Act (meant to boost U.S. semiconductor production) into nine quantum computing companies – legacy tech giant IBM (IBM) anchors the package with a massive $1 billion grant to launch a dedicated quantum chip foundry in New York, while chipmaker GlobalFoundries (GFS) lands $375 million, and specialized players like D-Wave Quantum (QBTS), Rigetti Computing (RGTI), and Infleqtion (INFQ) take home $100 million apiece. Now, as Washington deepens its state-backed industrial policy to counter China's tech dominance, these highly volatile quantum penny stocks are turning into heavily subsidized national security plays... triggering pre-market surges of up to 25%.
3. A flood of liquidity. The spread between the Secured Overnight Financing Rate (“SOFR”), which is the interest rate institutions pay to borrow cash overnight, versus the Federal Funds Rate (“FFR”) has increased to the widest level in four years. When this spread widens, it signals that institutions have an abundance of cash reserves. Thus, the widening SOFR-FFR spread signals that the financial system is awash in excess liquidity, which has likely been at least one driving force behind the sharp rally in stock prices in recent weeks.
Chart Of The Day… Nvidia (NVDA)
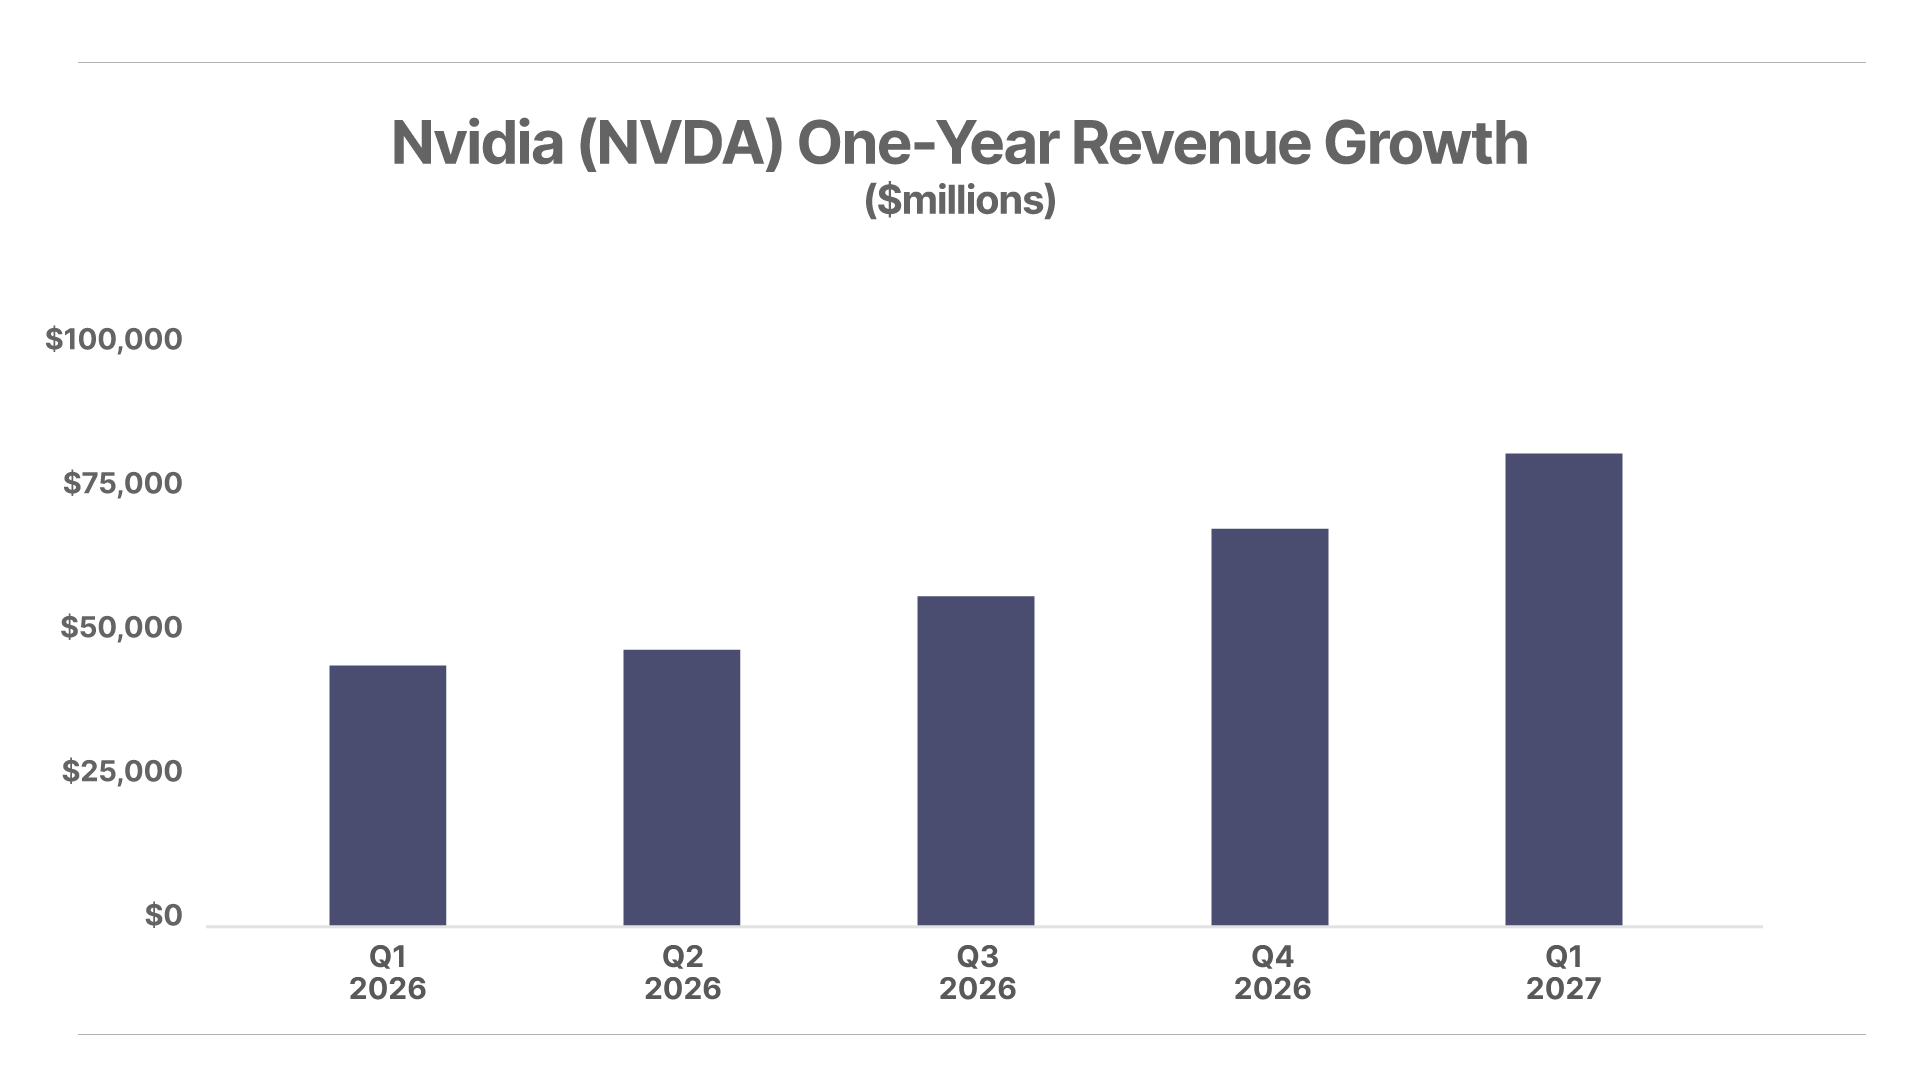
Complete Investor recommendation Nvidia (NVDA) released Q1 earnings yesterday – another massive beat met with a shrug. Q1 revenue of $81.6 billion topped the $78.75 billion consensus, with adjusted earnings per share of $1.87 versus $1.77 expected. Data centers – the engine – nearly doubled year-over-year to $75.2 billion, roughly 92% of total sales, and management guided next quarter to $91 billion. CEO Jensen Huang reported “demand has gone parabolic.”
Mailbag
“Question About Amrize Allocation”
Todd O. writes:
Porter,
I know you are not a registered financial advisor, and you don't give personal investment advice.
That said, since I've been reading your work for nearly 25 years now… and I’m someone who doesn't just "read" your work, but actually follows through on things when your ideas and my own personal views happen to intersect (which is quite often, admittedly).
Couple of examples...
December 2009 I took your advice and bought 100 shares of HSY around $36.50 – I have left it untouched in one of our retirement accounts and with dividends reinvested it's now 142 shares and worth >$27K
October 2010 I took your advice and bought 93 shares of WMT around $17.73 – I have left it untouched in one of our retirement accounts and with dividends reinvested it's now 170 shares and worth >$23K
March 2012 I took your advice and bought 335 shares of WRB around $16.38 –I have left it untouched in one of our retirement accounts and with dividends reinvested it's now 456 shares and worth >$31K
And that list doesn't even include one of my all-time favorites… the Rite-Aid bond recommendation back from when Mike Williams was an analyst in your stable and opened my eyes to the potential power of distressed debt investing (which is why I love the work of Marty Fridson and Andy Lipman on Distressed Investing so much!).
None of that is to toot my own horn... all credit goes to you and the extraordinary people you've surrounded yourself with over the years. My main regret is that I was in my late 20s/early 30s and just wish I had had more money to invest back then!
Well, we are blessed to be in a stage of life where we are fortunate to have more capital to invest and your consistent championing of Forever/Lindy stocks over the years is also something that really resonates with me.
So, to my question: You've often preached "never put more than 5% of portfolio" in any asset/trade idea. However, AMRZ is currently trading around $48.50, Jan Jenisch (CEO and chairman) just bought another 28K shares last week, which bring his total open market purchases to 1.3 million shares ($64 million of his own personal money) over the last nine months, the company recently announced a $1 billion stock buyback plan, all of the catalysts you mention in your research report are still in place (if not in even better position) and, here is the real eye opener, you literally wrote in your report: "In my entire career I’ve never – not once – seen a better investment idea. Nothing else even comes close."
That made me sit up in my chair. However, you're also one of the greatest salesmen (that's a compliment) that I have ever met and are, at least occasionally, guilty of hyperbole (which I also get, since you need to stand out in the financial newsletter business). So my question is this: Just like you were honest and transparent with your own portfolio at the conference this past fall, does AMRZ have the potential to be one of the greatest long-term compounding investments of our lifetimes? If so, would you potentially put it in the Budweiser (BUD)-type category, where the opportunity and asymmetric upside means it would be okay to allocate more than 5% of the overall portfolio to it?
Appreciate any thoughts that you're willing to share and please know how grateful we are to have you and your team as a resource. Keep up the great work!
Porter Comment: The second-best performing equity investment of all time is Vulcan Materials (VMC), which has compounded investors’ money at around 15% a year since the 1950s. But Vulcan’s history goes even further back. Solon Jacobs and Henry Badham founded it as the Birmingham Slag Company in 1909. The original business model was pure industrial recycling: transforming blast furnace slag – then considered a useless waste product of Birmingham’s booming steel mills – into cheap, highly durable aggregate for roadbeds and railway ballast. They sold out to the Ireland family in 1916. Under the Irelands, the firm shifted its focus toward natural aggregates (crushed stone, sand, and gravel) as the automobile era began. By the 1940s and 1950s, the company had diversified across the Southeast and became a principal supplier to massive federal infrastructure initiatives, including the Tennessee Valley Authority (“TVA”) and wartime military complexes like Oak Ridge. In 1951, Charles Ireland recognized the impending Interstate Highway System under the Eisenhower administration would require unprecedented quantities of aggregate. To reach the public markets (and raise the capital needed to build the highways) Birmingham Slag engineered a reverse merger in 1956 with the Vulcan Detinning Company of New Jersey. (I hope some day they change the company name back to Birmingham Slag.)
After the transaction, in 1957, Vulcan Materials began trading on the New York Stock Exchange and almost immediately executed the acquisition of nine regional aggregate and chemical firms (including Union Chemicals and Lambert Brothers). This established Vulcan's distinct dual operating model: Construction Materials and a newly minted Chemicals Division. For several decades, Vulcan’s chemical operations expanded, but it became increasingly obvious that the company’s best business was aggregates. Vulcan finally divested its chemicals business in 2005. And it has invested heavily in building America’s best aggregate business.
-
In 1987, Vulcan initiated the Crescent Market Project, establishing a massive limestone quarry on Mexico’s Yucatán Peninsula linked to deep-water seaports. This allowed Vulcan to bypass traditional rail bottlenecks and ship aggregates via massive 62,000-ton self-discharging ocean vessels directly to under-supplied coastal markets along the U.S. Gulf Coast and Florida.
-
In 1999: Acquired CalMat for $760 million, instantly expanding its footprint into California, Arizona, and New Mexico, and making Vulcan the largest aggregates producer on the West Coast.
-
In 2007: Executed its largest pre-crisis transaction, acquiring Florida Rock Industries for $4.7 billion to solidify a dominant position across the high-growth Sun Belt and Mid-Atlantic.
Its mines give Vulcan incredible pricing power. Vulcan consistently pushes annual price increases even when construction volumes dip. This gives Vulcan an incredibly high adjusted EBITDA margin of 29.3% and a strong return on equity (ROE) of 13.5%. That’s why Wall Street normally trades the stock at very high multiples of earnings. (Current P/E is 31).
What does that have to do with Amrize?
Amrize is following the same strategy, but in concrete. While I can’t know that it will succeed, it certainly has a good start. Like Vulcan, its moat comes from having an incredibly large, physical distribution network with over 1,000 concrete sites across North America. Its margins are almost as good (24% EBITDA) as Vulcan’s and its return on equity is likewise very good (over 10%). I expect these stats will improve over time as the newly independent Amrize will invest more in building up its moat, while continuing to raise prices. But, unlike Vulcan, which is well-known and highly valued, Amrize is still an “orphan.” As a spin-out from Swiss concrete maker Holcim, Amrize hasn’t yet found its home among dedicated institutional investors. It’s trading a forward (‘26) earnings multiple of around 18.
There is one very important thing to note: both of these companies, which will do very well over the long-term, are notoriously cyclical. After making new highs in 2007, Vulcan’s shares fell to under $30 by 2011 and didn’t make a new high until 2016. That makes these stocks hard for most retail investors to own: they require a lot of patience. For years these stocks can look like “dead money.” So, you’ll really have to know what you’re buying and have a long-term horizon if you want to earn market-beating returns in these names.
“End Of Paper Money”
In yesterday’s Journal, Porter shared an excerpt from his latest book 2029: The End of America, in which he compares the debasement of the currency in ancient Rome to what is happening with the U.S. dollar today. To get a copy of 2029, click here to order your own version now.
Jim D. writes:
Porter,
This article is a real eye opener! I wish that had been taught in history class in school. The constitution addresses “coining” money not printing it, and something about a budget, which we haven’t had in 50 years.
I am afraid my children and grandchildren will be living in a very different America than we do. The book of Revelations predicts “People will not be able to buy or sell without the mark of the beast.” Sounds like a chip implanted in hand with your digital account on it to me.
Thank you for being willing to tell uncomfortable truths!
“Timber REIT In Permanent Portfolio”
Wayne B writes:
After reading your book – awesome, by the way – I have one question. Why isn’t a timber REIT in your Permanent Portfolio? I added Weyerhaeuser – which seems to be relatively low-priced right now – along with a monthly recurring buy, right after reading that chapter.
Porter & Co. Market Snapshot
| Price | Yesterday's Return | Year-to-Date Return | |
|---|---|---|---|
| S&P 500 Index | $7,432.97 | 1.08% | 8.58% |
| Gold per ounce | $4,531.30 | 1.39% | 4.5% |
| Bitcoin | $77,457.77 | 0.91% | -12.0% |
| Oil (West Texas Intermediate) per barrel | $98.26 | -5.63% | 74.1% |
| Berkshire Hathaway (BRK) | $720,840.00 | 0.03% | -4.50% |
| Porter's Permanent Portfolio | - | 0.27% | 0.21% |
| The Better Than Berkshire Index | - | 0.09% | 2.4% |
| Total Return | Annual Return | ||
| Porter & Co's Top Ranked* | 33.1% | 14.5% | |
| Yield | Yesterday's Change | Change Year-to-Date |
|
| U.S Treasury 30-Year Yield | 5.12% | -6 bps | 28 bps |
*A Complete Investor risk rating of 1 is defined as a "low risk, high allocation" security, while positions rated closer to a 5 are higher risk. Porter & Co.'s top-ranked positions include those rated either 1 or 2 in Complete Investor portfolio.
Porter & Co. Top Positions
| Publication | Ticker | Description | Total Return |
|---|---|---|---|
| Complete Investor | BWXT | BWX Technologies | 255% |
| Tech Frontiers | QURE | uniQure | 237% |
| Complete Investor | BTC/USD | Bitcoin | 187% |
| Tech Frontiers | ROIV | Roivant Sciences | 143% |
| Complete Investor | PM | Philip Morris | 133% |
| Tech Frontiers | QURE | uniQure | 131% |
| Tech Frontiers | SGMT | Sagimet Biosciences | 123% |
| Tech Frontiers | TGTX | TG Therapeutics | 114% |
| Distressed Investing | HLF | Herbalife | 102% |
| Distressed Investing | PTON | Peloton Interactive | 97% |
Prices as of 4:00 pm ET May 20, 2026
Please note: The investments in our “Porter & Co. Top Positions” should not be considered current recommendations. These positions are the best performers across our publications – and the securities listed may (or may not) be above the current buy-up-to price. To learn more, visit the current recommendations page of the relevant service, here. To gain access or to learn more about our current recommendations, call our Customer Care team at 888-610-8895 or internationally at +1 443-815-4447.