Issue #71, Volume #3


What Drove Berkshire’s Incredible Returns Was Leverage – Why That’s Good News For You
Inside today's Daily Journal…
|
Editor’s Note: Today’s Journal is the fifth from Porter Stansberry about the decline of Berkshire Hathaway. On Friday we will publish our new Better Than Berkshire Index for all paid-up subscribers to Porter Stansberry's Complete Investor. This is a portfolio of common stocks we created last year specifically to outperform Berkshire Hathaway. Over the past year its “delta” (the percentage difference between our Better Than Buffett Index and Berkshire Hathaway) was 15%.
To get access to the new Better Than Berkshire Index – as well as the list of 40 or so recommended stocks, the editorial Roundtable, and so much more that we provide in Complete Investor, click here.
Warren Buffett’s public reputation rests on a simple claim: he is the greatest stock picker in history. But like most of what the public believes about Buffett and Berkshire, that is not true. There is nothing special about Buffett’s stock picking.
But that doesn’t mean that Buffett wasn’t a great investor. He was! Buffett was, by far, the greatest investor in history, by a huge margin.
Over 486 months between October 1976 and March 2017 – 41 years of continuous operating data – Berkshire Hathaway’s Class A stock earned an average excess return of 18.6% per year above U.S.Treasury bills. Annualized volatility was 23.5%. Sharpe ratio: 0.79.
(The Sharpe ratio is the standard academic measure of risk-adjusted performance. It asks a simple question: how many units of return did you earn per unit of risk you took? A Sharpe of 0.5 is ordinary for the broad U.S. stock market. A Sharpe of 1.0 is excellent – world class for any investor. Berkshire’s Sharpe ratio of 0.79 is roughly 1.6x the broad U.S. stock market’s Sharpe ratio of 0.49 over the same period. Against the S&P 500 specifically, Berkshire’s information ratio – the excess return beyond the index, adjusted for the volatility of that excess – was 0.64.)
Among all large-cap U.S. stocks and mutual funds with 30-plus-year continuous track records, those are unmatched numbers.
One dollar invested in Berkshire on October 31, 1976, was worth more than $3,685 by March 31, 2017. A dollar invested in the S&P 500 with dividends reinvested over the same period was worth approximately $76. Buffett beat a passive index by a multiple of 48.
But he didn’t do it with stock picking.
Three researchers at AQR Capital Management – Andrea Frazzini, David Kabiller, and Lasse Heje Pedersen – dissected Berkshire’s 50 years of investments through 2013. They expanded and republished their findings in 2018 in the Financial Analysts Journal, which is the most highly respected industry publication. Their work won the Graham and Dodd Award for the best published paper of the year. The paper is called, simply, Buffett’s Alpha.
(Alpha, for those of you not up to speed on all of the latest financial jargon, is a measure of investment performance that is not correlated to the overall increase of the market itself. It is, therefore, the measure that great investors judge themselves by.)
They found, after accounting for cheap leverage and exposure to a handful of publicly documented factor premiums, Buffett’s investment skill – the portion of his returns that cannot be explained by any mechanical strategy – is 0.3% per year.
That number is statistically indistinguishable from zero. In other words, the alpha that Berkshire enjoyed for 50 years (as it compounded capital at 24% a year!) wasn’t due to Buffett’s stock picking.
So how did he do it? He did it by gaining access to a huge amount of investment capital that he did not own, for free. Buffett’s track record was built on leverage. That’s a dirty word for most investors, but it was how Buffett gained access to this leverage that is the real miracle at Berkshire Hathaway.
The AQR researchers had access to something most Buffett commentators do not: 40 years of Berkshire’s audited financial statements, the full quarterly history of the public 13F stock portfolio, and the entire academic factor-return library that has been built out since Eugene Fama and Kenneth French published their three-factor model in 1992.
The researchers asked a specific question:
If I take Berkshire’s monthly stock returns from October 1976 through March 2017, and I run a linear regression against a set of well-documented risk factors – market beta, size, value, momentum, and two newer factors called Betting-Against-Beta and Quality-Minus-Junk (detailed below) – how much of Buffett’s performance can the factors explain? And after the factors have been stripped out, how much excess return remains?
The data show clearly there are a few qualities that drove Berkshire’s results.
-
First, Buffett has always preferred large-cap stocks, contrary to the popular image of him as a small-cap value investor. He buys elephants.
-
Second, no surprise, Buffett buys cheap. Berkshire is almost six standard deviations away from neutral on the value axis.
So far the picture is ordinary. Every large-cap value manager in America loads positively on size and on value. Buffett’s genius lies in the last two factors.
These last two factors are a little complicated, but please stick with me. This is very important for your own investing.
There’s a new factor that, like value and size, characterizes Buffett’s strategy. It’s called Betting-Against-Beta (“BAB”). What it means is intentionally investing in stocks with very low volatility.
Beta is a measure of a stock’s price volatility. (Specifically, it is the standard deviation of its monthly price changes compared to the S&P 500’s volatility.) A stock with a beta of 1 has the same amount of volatility as the S&P 500. A stock with a beta of 0.5 has half the volatility of the S&P 500. The Hershey Company (HSY), one of my long-time favorite investments, is a notoriously low beta stock… 0.40, 40% of the market.
The BAB factor captures the excess return that accrues to investors who own low-beta stocks. Low-beta stocks have historically earned higher risk-adjusted returns than high-beta stocks. Financial theory teaches that higher beta (higher risk) should mean higher return. But it doesn’t. The opposite occurs, in fact. And Buffett was one of the very first people to figure this out.
Why does this factor persist? In an efficient market, once that factor is known to investors, then they should bid the price up on low-beta stocks until it no longer provides an edge.
The explanation per the theory of AQR’s Frazzini and Pedersen is that because ordinary investors do not use leverage and seek high returns, they create persistent excess demand for more volatile stocks. (Having worked with retail investors for 30 years, I can assure that is true.)
An investor with access to cheap leverage – Warren Buffett, for instance – can exploit the mispricing by owning the low-beta names and levering them up to produce market-beating returns.
And the last factor that matters to Buffett is quality. Buffett buys companies with high returns on invested capital.
Quality-Minus-Junk (“QMJ”) is a factor described by Cliff Asness, also at AQR with Frazzini and Pedersen, in a 2019 paper in Review of Accounting Studies. The QMJ factor captures the return to owning stocks of high-quality companies – profitable, growing, safe, with high payout ratios – against stocks lacking those characteristics.
QMJ has been positive and statistically significant in every major developed equity market for which it has been measured. Berkshire’s loading is 0.37, with a t-statistic of 4.6. – meaning it is highly significant to Berkshire’s results.
In plain English: Buffett only buys large, high-quality, low-volatility stocks. And Berkshire’s results were not, in any way, unusual. Any investor buying these same kinds of stocks would have earned those same returns – about 16% a year over time. So how did Berkshire compound at twice that rate?
To figure that out, AQR’s researchers built a Berkshire replica. They constructed a simple, rules-based, publicly investable portfolio that mechanically tilts toward large-cap, cheap, low-beta, high-quality stocks, and levers it 1.6-to-1 to match Berkshire’s insurance float leverage. The correlation between their replica’s returns and Berkshire’s were virtually identical.
The authors’ conclusion is unambiguous.
In summary, we find that Buffett has developed a unique access to leverage that he has invested in safe, high-quality, cheap stocks and that these key characteristics can largely explain his impressive performance.
Berkshire’s cost of insurance float has averaged almost three percentage points below the Treasury bill rate across 50 years of data.
In roughly two-thirds of all years, Berkshire has been paid to hold other people’s money. That is not an investment strategy. That is a financing miracle.
It is also the living, breathing heart of Berkshire Hathaway. It’s what Buffett built, starting in 1967 when he paid $8.6 million for National Indemnity’s $19.4 million of float. And it is the factor every retail investor admiring Berkshire’s returns has never paid any attention to.
The 1.6-to-1 leverage that AQR measured over the full period, financed at this negative cost, explains the dollar magnitude of Berkshire’s returns.
How do we know? An unleveraged version of the same stock portfolio – which you can approximate by looking at the 13F holdings alone – has earned an average excess return of 12% per year. “Excess return” means the annual return in excess of the risk-free rate of return, the U.S. Treasury bill rate.
It’s Berkshire’s leverage that magnifies this excess return to 18.6%.
How does this square with Berkshire’s reported gains? Berkshire’s 18.6% excess return, plus the T-bill rate that averaged roughly 4.7% over 1976–2017, gives you a total nominal return of roughly 23% per year, which is the figure you usually see quoted for Berkshire’s historical performance.
The 23% tells you what Berkshire returned. The 18.6% tells you how much of that return was compensation for taking investment risk, as opposed to the baseline yield every lender to the U.S. government was earning anyway.
With both of Berkshire’s “edges” – systematic factor exposures to cheap, high-quality, low-volatility stocks and roughly 1.6-to-1 leverage delivered with insurance float – you get Berkshire Hathaway’s 23% annual gains over 60 years.
It’s the structure that’s genius, not the stock picking.
And the structure still works – with or without Buffett. The trouble is, over the last 25 years Berkshire moved away from that structure.
I’ll tell you more about what went wrong in a future Journal.
Tell me what you think of today’s Journal – good, bad, or anything in between: porterstansberrydirect@gmail.com
Good investing,
Porter Stansberry
Stevenson, Maryland
3 Things To Know Before We Go…
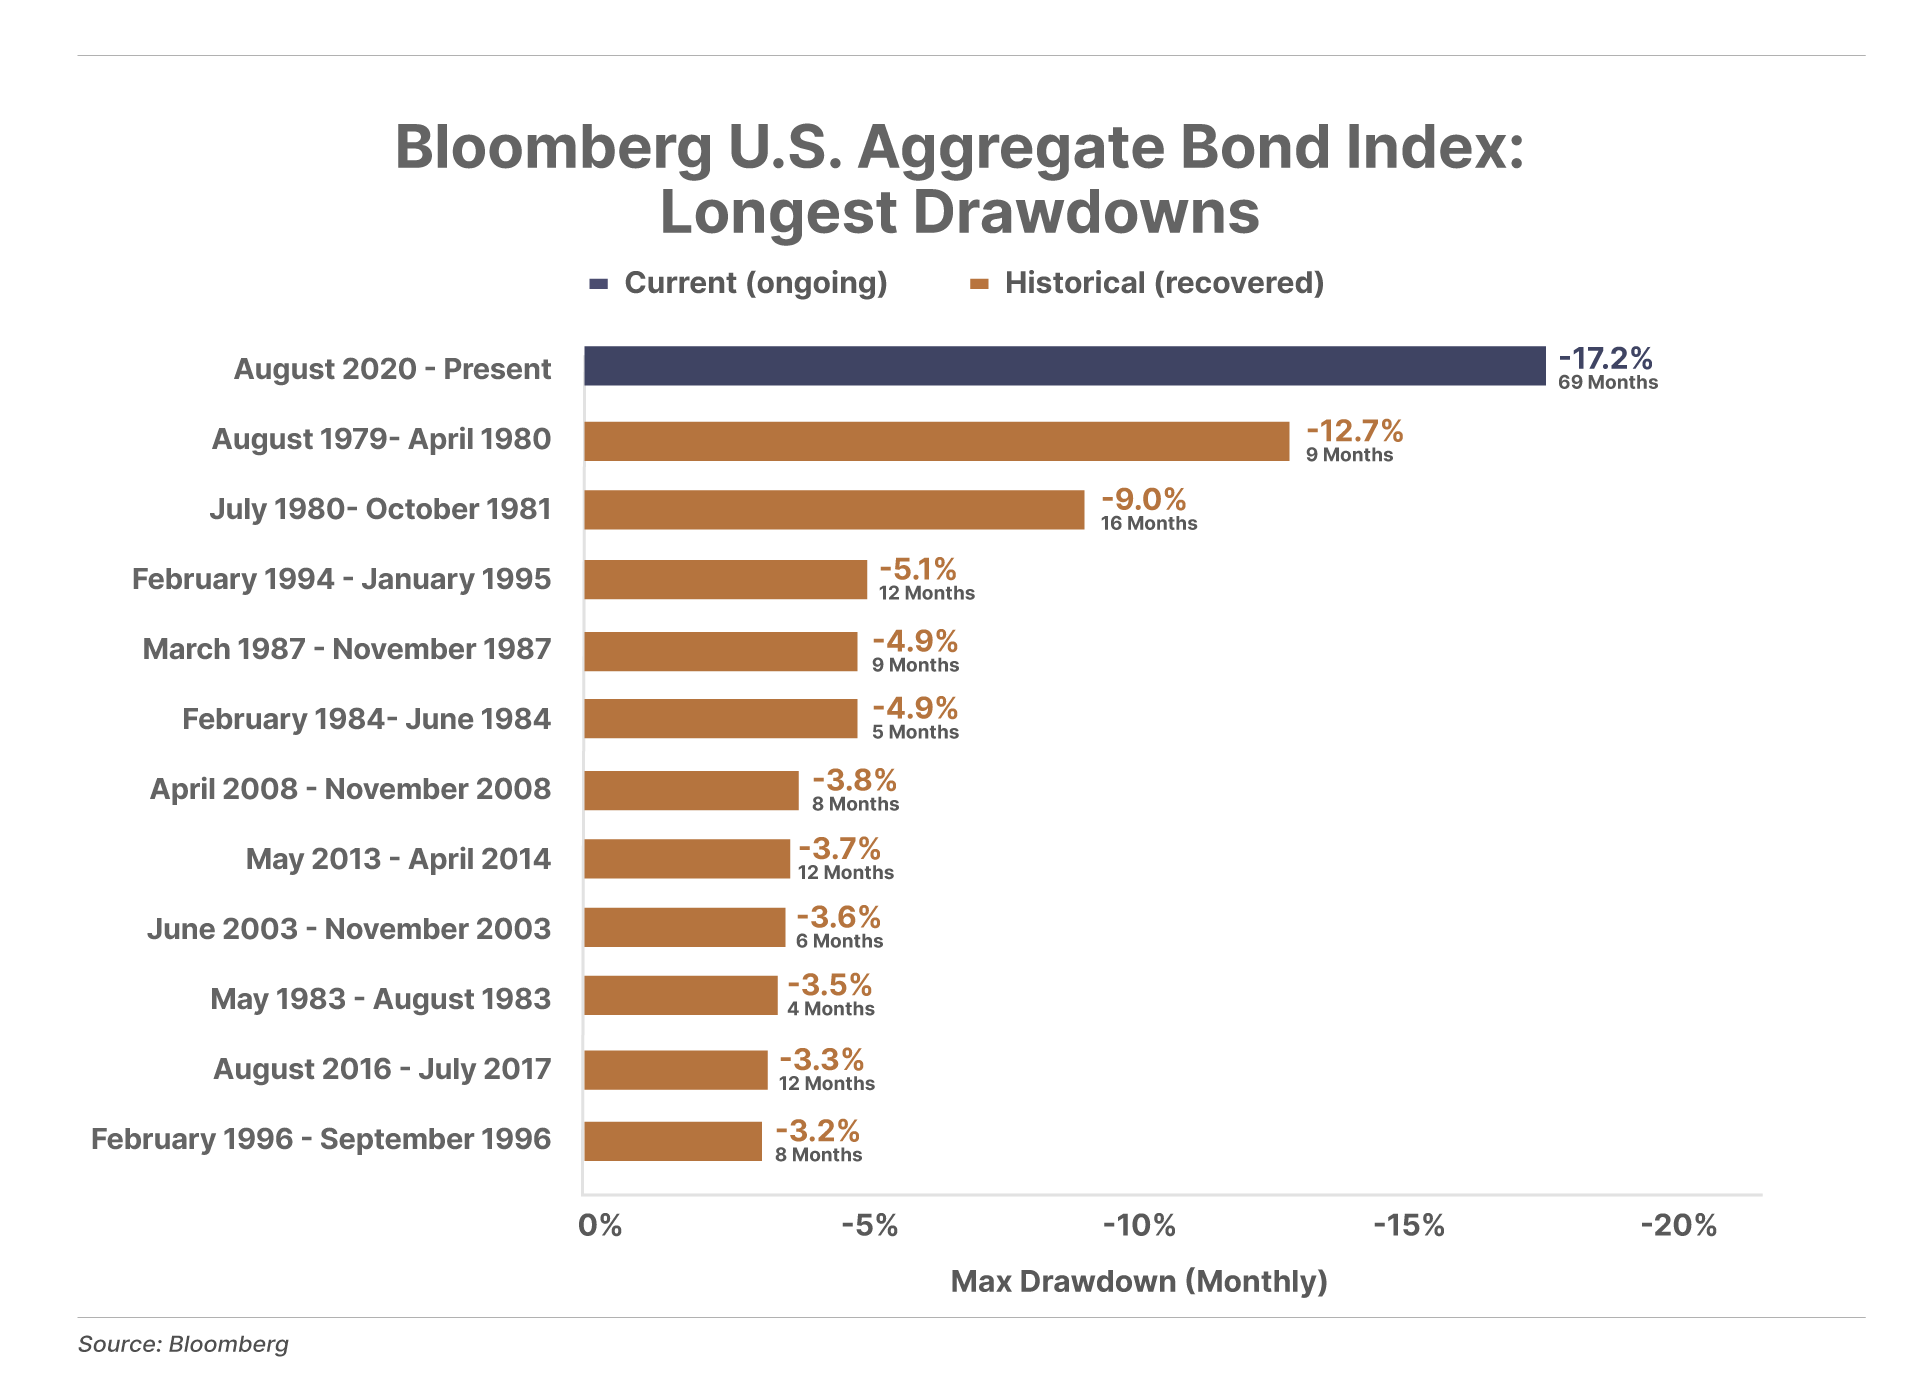
1. The bond bear market continues. The U.S. bond market has now been in a drawdown for 69 months, the longest period without making a new high since 1976. Not coincidentally, this extended bond bear market has occurred alongside the first significant rise in consumer price inflation since the late 1970s.
2. British American Tobacco gets favorable FDA ruling. Yesterday, the Food And Drug Administration (“FDA”) announced authorization of e-cigarettes to include new flavors beyond tobacco and menthol – a major policy reversal from its prior crackdown on flavors, which stymied U.S. vape sales. This should bode well for British American Tobacco’s (BTI) Vuse product, the most popular vaping brand in America with 32% market share. British Tobacco is one of our favorite Complete Investor Forever Stocks, with shares up 54% since our recommendation last March.
3. Uber shares rise on Q1 news. Complete Investor recommendation Uber (UBER) reported Q1 revenue of $13.2 billion – a 14% year-over-year increase – falling short of consensus estimates. However, the company outperformed on profitability, reporting earnings per share (“EPS”) of $0.72 (up 44% year-over-year) and EBITDA of $2.48 billion, up 33% year-over-year. The company also provided optimistic Q2 guidance – shares jumped 7% on the news.
Chart Of The Day… Credit Acceptance (CACC)
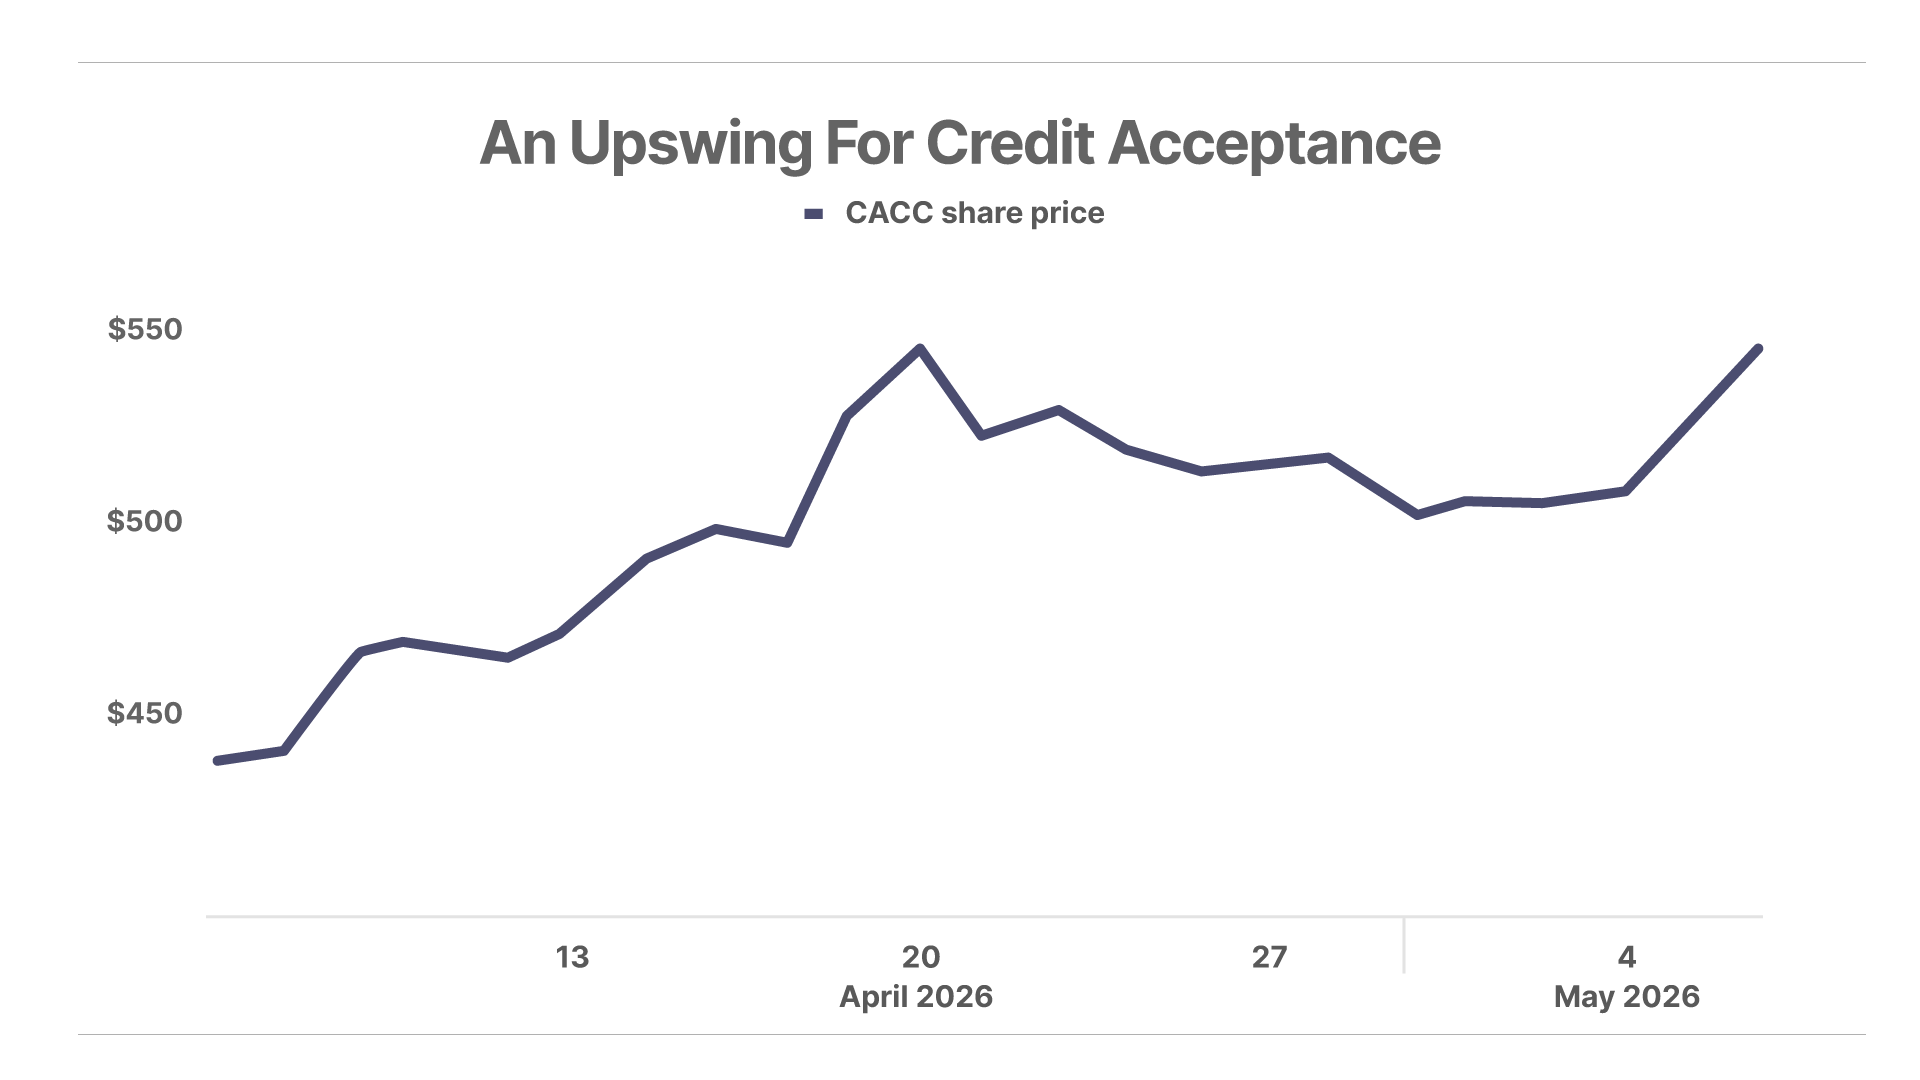
Shares of Complete Investor recommendation Credit Acceptance Corporation (CACC) are trading higher following strong Q1 earnings – with EPS of $10.71, surpassing analyst estimates of $10.50. Investors responded positively to stabilized loan portfolio trends and a significant reduction in credit loss provisions, sending the stock up 4% today – leading to a monthly 24% gain.
Today’s Poll… Berkshire Hathaway vs. The S&P 500
Mailbag
“Buffett’s Mistakes”
John L. writes:
Hi Porter:
Great article.
What I think, and I’m probably way off, is that Warren just doesn’t give a fuck anymore.
Or he is deliberately sinking the ship so he can be remembered as one of the greatest investors and the only one who could run Berkshire successfully.
Like I said, I’m probably way off, but those thoughts could explain these mistakes.
Porter Comment: Uh…? I’m certain that’s not it.
“KNSL Portfolio Question”
Bill L. writes:
Greetings…
I am emailing to ask about the Kinsale Capital (KNSL) holding in Porter's Permanent Portfolio. It is now down about 30% while the other insurance holdings have much smaller increases and decreases.
Your March 2026 Best Buys issue indicates that this is normal and okay for KNSL. Should we take advantage of this disparity and move a portion of the other five insurance holdings into KNSL, sort of a rebalance?
Porter Comment: Kinsale is exclusively an excess and surplus (E&S) lines insurer. That’s the segment of the property and casualty (P&C) market that’s most impacted by “soft market” conditions, like we see now. Kinsale is exhibiting great discipline by not chasing business by lowering its underwriting standards. These cycles are normal. The beauty of Porter’s Permanent Portfolio is its “set-and-forget” process. You’ll notice that we don’t do any trading in that strategy until after a full year.
“Amrize Question”
Brian M. writes:
Hello, I'm following Amrize (AMRZ) closely and I know you do too! I see they just authorized the buyback of up to $1 billion worth of shares.
Based on today's numbers it appears this could remove 3% to 4% off the market and they indicated they would return that capital back to the shareholders.
How much will this influence the price as this process plays out?
Also I would love to attend the annual retreat / conference at your farm. How could I do this? I'll bring the average age down a little.
Porter Comment: I doubt the buyback will impact the share price much in the short term. But over the long-term, continuous buybacks at this scale will make a huge difference to your returns. As far as coming to the annual conference at my farm, we’d love to have you. Just give us a call. I don’t know how many seats are still available (if any): 844-933 9986.
Porter & Co. Market Snapshot
| Price | Yesterday's Return | Year-to-Date Return | |
|---|---|---|---|
| S&P 500 Index | $7,259.22 | 0.81% | 6.4% |
| Gold per ounce | $4,556.92 | 0.76% | 8.4% |
| Bitcoin | $81,647 | 2.14% | -6.1% |
| Oil (West Texas Intermediate) per barrel | $102.27 | -2.54% | 60.7% |
| Berkshire Hathaway (BRK) | $699,965 | -0.40% | -7.3% |
| Porter's Permanent Portfolio | - | 0.51% | -1.1% |
| The Better Than Berkshire Index | - | -0.03% | 4.37% |
| Total Return | Annual Return | ||
| Porter & Co's Top Ranked* | 32.2% | 15.1% | |
| Yield | Yesterday's Change | Change Year-to-Date |
|
| U.S Treasury 30 - Year Yield | 4.99% | -3 bps | 14 bps |
*A Complete Investor risk rating of 1 is defined as a "low risk, high allocation" security, while positions rated closer to a 5 are higher risk. Porter & Co.'s top-ranked positions include those rated either 1 or 2 in Complete Investor portfolio.
Porter & Co. Top Positions
| Publication | Ticker | Description | Total Return |
|---|---|---|---|
| Complete Investor | BWXT | BWX Technologies | 261% |
| Tech Frontiers | QURE | uniQure | 237% |
| Complete Investor | BTC/USD | Bitcoin | 200% |
| Tech Frontiers | SGMT | Sagimet Biosciences | 143% |
| Tech Frontiers | QURE | uniQure | 131% |
| Tech Frontiers | ROIV | Roivant Sciences | 126% |
| Complete Investor | PM | Philip Morris | 112% |
| Tech Frontiers | TGTX | TG Therapeutics | 105% |
| Distressed Investing | HLF | Herbalife | 102% |
| Tech Frontiers | SGMT | Sagimet Biosciences | 98% |
Prices as of 4:00 pm ET May 5, 2026
Please note: The investments in our “Porter & Co. Top Positions” should not be considered current recommendations. These positions are the best performers across our publications – and the securities listed may (or may not) be above the current buy-up-to price. To learn more, visit the current recommendations page of the relevant service, here. To gain access or to learn more about our current recommendations, call our Customer Care team at 888-610-8895 or internationally at +1 443-815-4447.