Issue #93, Volume #3

How Leviathan Broke The World In 1973
Inside today’s Daily Journal…
|
I suspect when you start to read today’s Journal you’ll think, Oh, I’ve read this before.
But, trust me, you haven’t. Because the ending has never happened in America before.
This week’s Journals are going to be especially important – perhaps the most important of my entire career. I hope you will read them very carefully.
Let’s start with the part of the story that you probably do know.
In 1972 the market was carried by 50 stocks. They called them the Nifty Fifty: IBM (IBM), Xerox (XRX), Polaroid, Avon, McDonald’s (MCD), Coca‑Cola (KO), The Walt Disney Company (DIS), Merck (MRK). Investors decided these were the only companies worth owning. They bought them at any price. The average stock in the group traded at 41.9x earnings, more than double the 18x to 19x for the S&P 500. Polaroid traded at 95x earnings. McDonald’s and Disney at 71x.
These were so‑called “one‑decision stocks.” You bought them once and you never sold, because the growth would justify the price, eventually. The money piled into the same handful of tickers. And as the stocks went higher and higher, the thesis was proved: these were the only stocks investors needed.
It’s easy to see the correlation to today’s incredible bull market. But the concentration is even more intense than 1972. It’s not the Nifty Fifty. Today it’s more like five stocks. One company, Nvidia (NVDA), is worth more than $5 trillion by itself. Apple (AAPL) trades at 38x earnings. Tesla (TSLA) trades at 232x.
Like I said at the beginning – this probably sounds familiar.
You’ve heard this before and you either don’t care because you want to own stocks that are going up, or you don’t care because you’re not crazy enough to own a $5 trillion company trading at 20x sales (Nvidia).
But you should care, even if you don’t own these stocks, because this equity bubble is a sign of much bigger problems in our economy. Here’s what you haven’t been told about these bubbles: they aren’t really created by equity investors. They are created by the government.
Do you remember what former U.S. Attorney General Pam Bondi said to members of Congress when asked about why the Jeffrey Epstein files still hadn’t been released as promised? She said: Who cares? The stock market is at a new high.
When the people who control the money-printing press want a bull market to justify their policies, look out.
Much like President Donald Trump is doing today, Richard Nixon ran the deficit hot into his 1972 reelection.
The federal government ran shortfalls of roughly $23 billion in fiscal 1971 and again in 1972. It doesn’t sound like much on today’s scale, but these deficits were 10x larger than the deficits of 1970. At the time, these were enormous levels of debt.
To keep rates low and the economy running hot, Nixon pressured Federal Reserve Chair Arthur Burns to flood the system with money before the election. Burns cut the discount rate despite inflation moving higher. Money supply was growing by double digits.
Last year, the federal government ran a deficit of almost $2 trillion, spending 34% more than it collected. The government, already supporting unprecedented debts, is running a deficit that is 6% of GDP – during peacetime and with full employment. This hasn’t happened since the 1970s.
Even so, President Trump wants lower rates and says so constantly. His administration indicted a sitting member of the Federal Reserve, and Trump launched a criminal investigation of the Federal Reserve chairman too. These are unprecedented actions.
People who love Trump will defend all of these actions as being good for the country – America First. People who hate Trump will call him a dictator.
But there’s much deeper meaning behind all these things. Take the red pill. Look at what’s really driving these events.
Nixon was, like Trump, an aggressive president. He kept an enemies list. He turned the IRS on his opponents. And powerful people hated him. In October 1973, Nixon ordered the firing of the special prosecutor investigating him, and his attorney general and deputy attorney general resigned rather than firing him, in what is called the Saturday Night Massacre. A unanimous Supreme Court forced him to turn over the Watergate tapes, a bipartisan Congress moved to impeach him, and in August 1974 he resigned.
Trump issued roughly 225 executive orders in the first year of his second term, has deployed the armed forces on American streets, has installed loyalists at the FBI and the Justice Department, and is using law enforcement to settle political scores.
Before you claim that I have TDS – Trump Derangement Syndrome – please read what I have to say.
The issue isn’t whether Trump is justified in taking these actions or even whether or not they’re good or bad for the country. There’s a deeper meaning.
In 1973 historian Arthur Schlesinger published The Imperial Presidency, with the thesis that Nixon was not an aberration but a culmination – that as the size of the federal government grew to become the dominant institution in the country, it was inevitable that our presidents would become dictators.
It isn’t merely a cult of personality. It is a leviathan.
Today, all state and local governments combined spend around $3.7 trillion annually. That’s half of federal outlays. The largest U.S. corporations have annual revenue in the low hundreds of billions. Even the very largest private or quasi‑public systems (hospital groups, universities, Fortune 10 firms) are one order of magnitude (10x) smaller than the federal budget taken alone.
The federal government is not just the largest “institution” in America. It is larger than any private institution by at least a factor of 10.
A leviathan spiraling toward insolvency, with a printing press, isn’t going to suddenly become chaste. It is going to defraud its creditors. And it is going to force the world to continue to take its worthless currency.
It has happened before.
In October 1973 Egypt and Syria attacked Israel on the Jewish holiday Yom Kippur. The United States resupplied Israel, and the Arab oil producers answered with an embargo. Oil ran from $3 a barrel to nearly $12 in a matter of weeks, a 300% increase.
What Americans were never told was that America’s involvement in this war was never about Israel. It was always a war over the dollar. Israel was only the battleground.
Before 1973, OPEC oil was paid for in U.S. dollars. That’s because the dollar was the center of the Bretton Woods currency agreement: it was as good as gold. But after Nixon defaulted on that promise in August 1971, the Saudis demanded the U.S. honor the gold price for its oil. And they threatened to trade oil in other currencies if we didn’t. The war proved to the Saudis and the other OPEC nations they had no choice: accept the dollar or face destruction. The U.S. and Saudi Arabia secretly struck an agreement where Saudi oil would continue to be sold for dollars and Saudi surpluses would be recycled into dollar assets, especially U.S. Treasuries. In return, we guaranteed the Saudis’ sovereignty – most importantly, we promised to protect them from Iran.
This agreement held until the massive COVID inflation.
After we printed $5 trillion in a year, senior Saudi officials began publicly saying at the World Economic Forum in Davos and elsewhere that they were open to settling oil trade in currencies other than the dollar, breaking the greenback monopoly. And in 2024 Saudi Arabia quietly let its old, informal understanding about pricing oil exclusively in dollars lapse, signaling that, while most deals still clear in dollars, the Saudi kingdom reserves the right to accept other currencies, especially China’s yuan, for at least some exports.
Today, about 25% of the world’s oil is priced in Chinese yuan – not dollars. The leading non‑dollar exporter? Iran.
Don’t watch the news. Watch the money.
What this war is really about is ensuring that the Saudis (and the rest of the Arab Gulf) cannot leave the dollar system. But will that work this time? And at what cost? The market doesn’t know.
Brent crude oil is sharply higher this year. Analysts at major banks are modeling $120 to $150 a barrel global oil prices if the Strait of Hormuz remains closed for much longer. Energy inflation in the latest American data runs at 17.9%, and it is dragging the headline inflation rate back up. War, then oil, then inflation. That was the sequence in 1973.
It will happen again. And, once again, the U.S. monetary authorities will monetize the spiraling costs, leading to vastly higher rates of inflation.
Here’s what happened last time.
The Dow Jones Industrial Average peaked at just over 1,000 in January 1973. It bottomed at 577 in December 1974, a fall of 45%. The S&P 500 lost about 15% in 1973 and then another 26% in 1974. Real GDP swung from +7.2% in 1972 to –2.1% in 1974. Inflation ran from 3.4% to 12.3%. The unemployment rate doubled.
The Nifty Fifty, the unkillable one‑decision stocks, were slaughtered. Their multiples collapsed from 42x earnings to under 10x earnings. Polaroid fell 91%. Avon fell 86%. Xerox fell 71%. The market did not reclaim its 1973 high, in nominal terms, until 1981. In real terms (adjusted for inflation) the market didn’t recover for 25 years.
Today the bubble is more concentrated. The deficits and the debt are vastly larger. The government is vastly more powerful and far more desperate to maintain its fiscal hegemony over the world’s economy. Loudoun County, Virginia – outside of Washington, D.C. – has been the richest county in the United States since just after the Global Financial Crisis. It will destroy the entire country to remain so.
The crisis hasn’t happened yet. The labor market is booming. The economy is growing fast. You’ll see headline after headline going into the elections this fall that America’s economy is the strongest it has ever been. But don’t forget, in 1972 GDP growth was 5% – one of the strongest growth rates post‑WWII.
Tomorrow, I’ll show you something about the Nifty Fifty that most people don’t know: investors weren’t wrong.
And I’ll show you exactly how to protect yourself from what’s coming.
Tell me what you think of today’s Journal: porterstansberrydirect@gmail.com
Good investing,
F. Porter Stansberry
Stevenson, Maryland
P.S. Over the weekend, we released a very special offer – great for a graduation gift, fathers day, or even for yourself… It’s The OneBlade Genesis – the world’s best single-blade safety razor. It comes with a patented floating head that makes shaving safe, easy, and effortless. Made from hand-polished German 316L steel, backed by a forever warranty… You can still claim the offer we released yesterday: Get yours today (use code PORTER15 for a 15% discount).

3 Things To Know Before We Go…
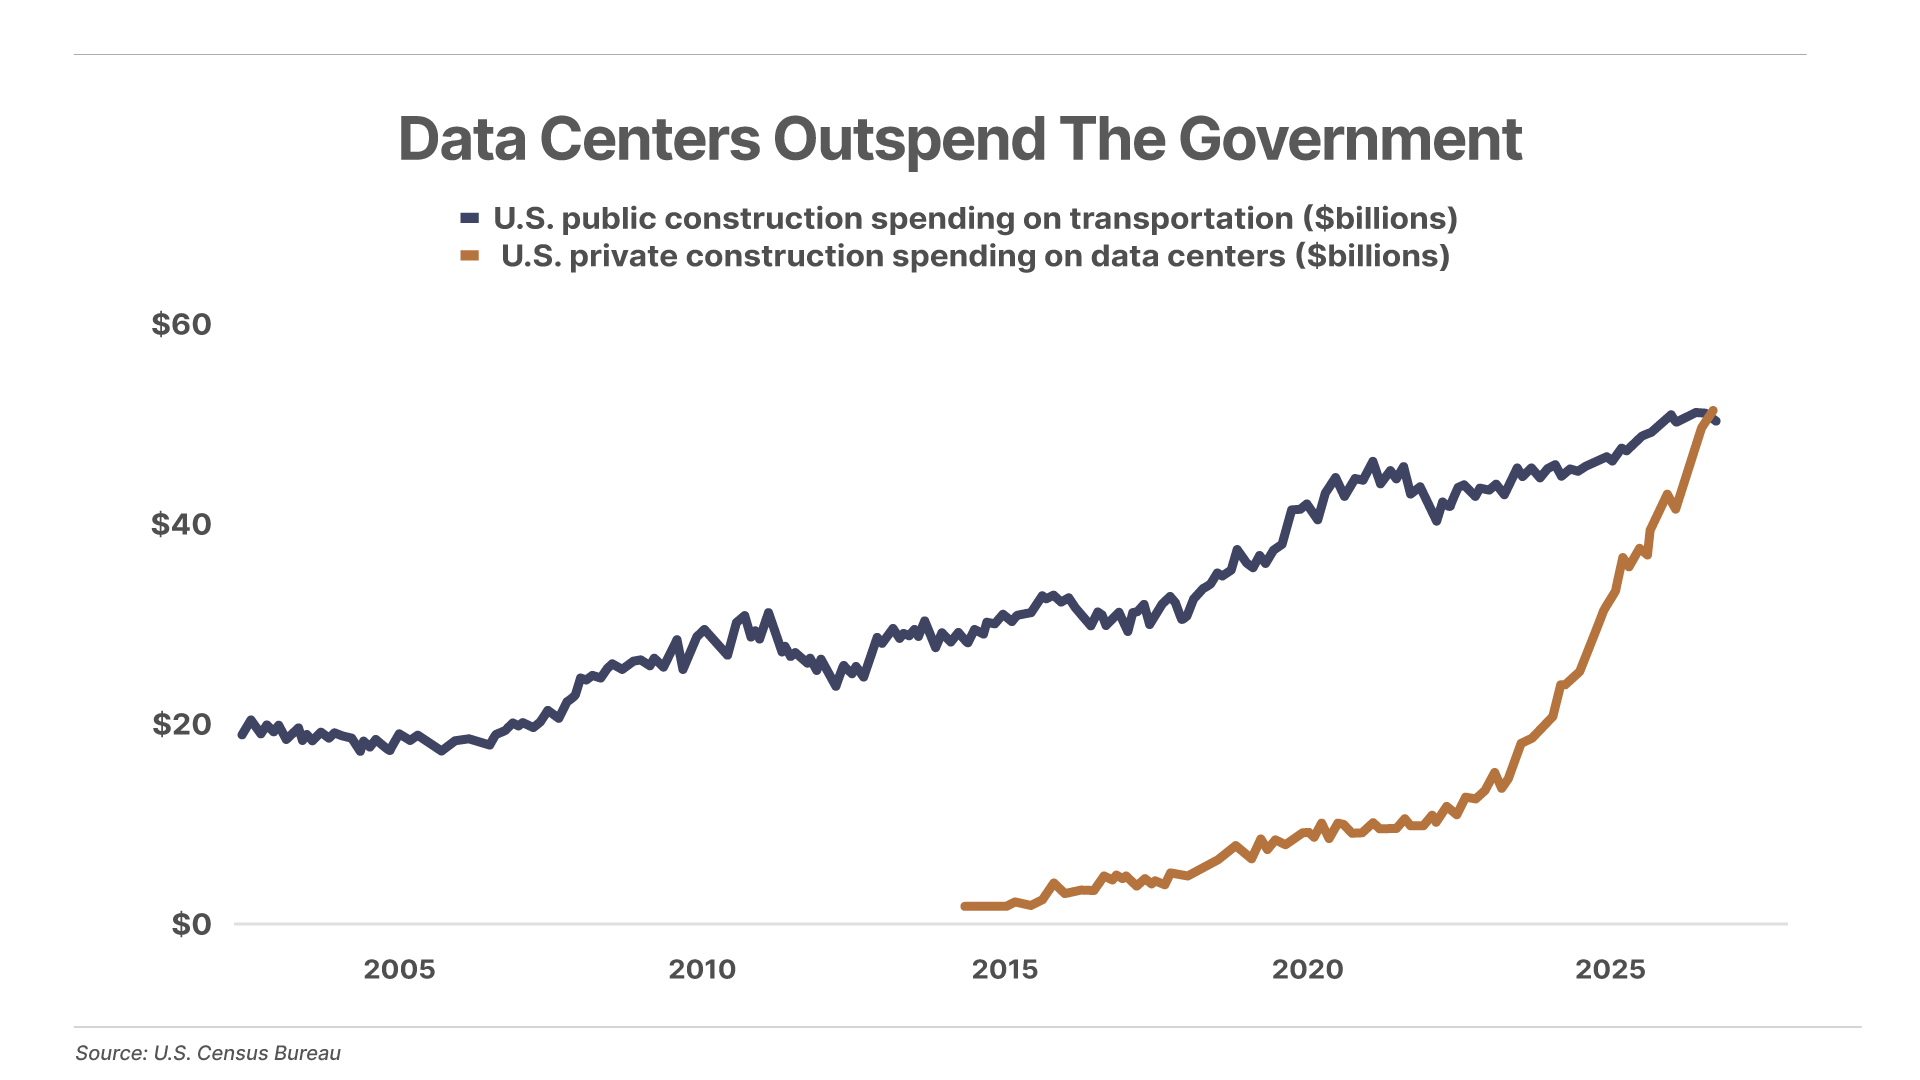
1. Data center construction overtakes public-transit infrastructure. In April 2026, private data-center construction hit an annualized spending rate of $50.7 billion – eclipsing public transportation-structure construction on airports, mass transit, and marine terminals ($49.9 billion) combined. The driver is hyperscaler capex – and with $88 billion in preconstruction, 2026 will dwarf the record.
2. Central banks fall behind inflation goals. With the Iran war pushing up global commodity prices, inflation is becoming a growing problem for central banks. A total of 46 out of 68 central banks are now facing consumer prices rising at rates well above their inflation targets – including the U.S. running 1.8 percentage points above target, the Eurozone 1.2, and the UK 0.8. As a result, bond yields are breaching multi-year highs across the globe.
3. Nvidia doubles down on physical AI. Chip leader Nvidia (NVDA) has partnered with South Korea’s LG Group to co-develop humanoid robots and next-generation data centers, marking a major milestone in Nvidia’s aggressive push into physical artificial intelligence (“AI”). By capturing the end-to-end pipeline – spanning from virtual simulation training to robotics and spatial intelligence via the Jetson AGX Thor chip – Nvidia is turning physical AI into its next multitrillion-dollar commercial market.
Chart Of The Day… S&P 500 Insurance Index
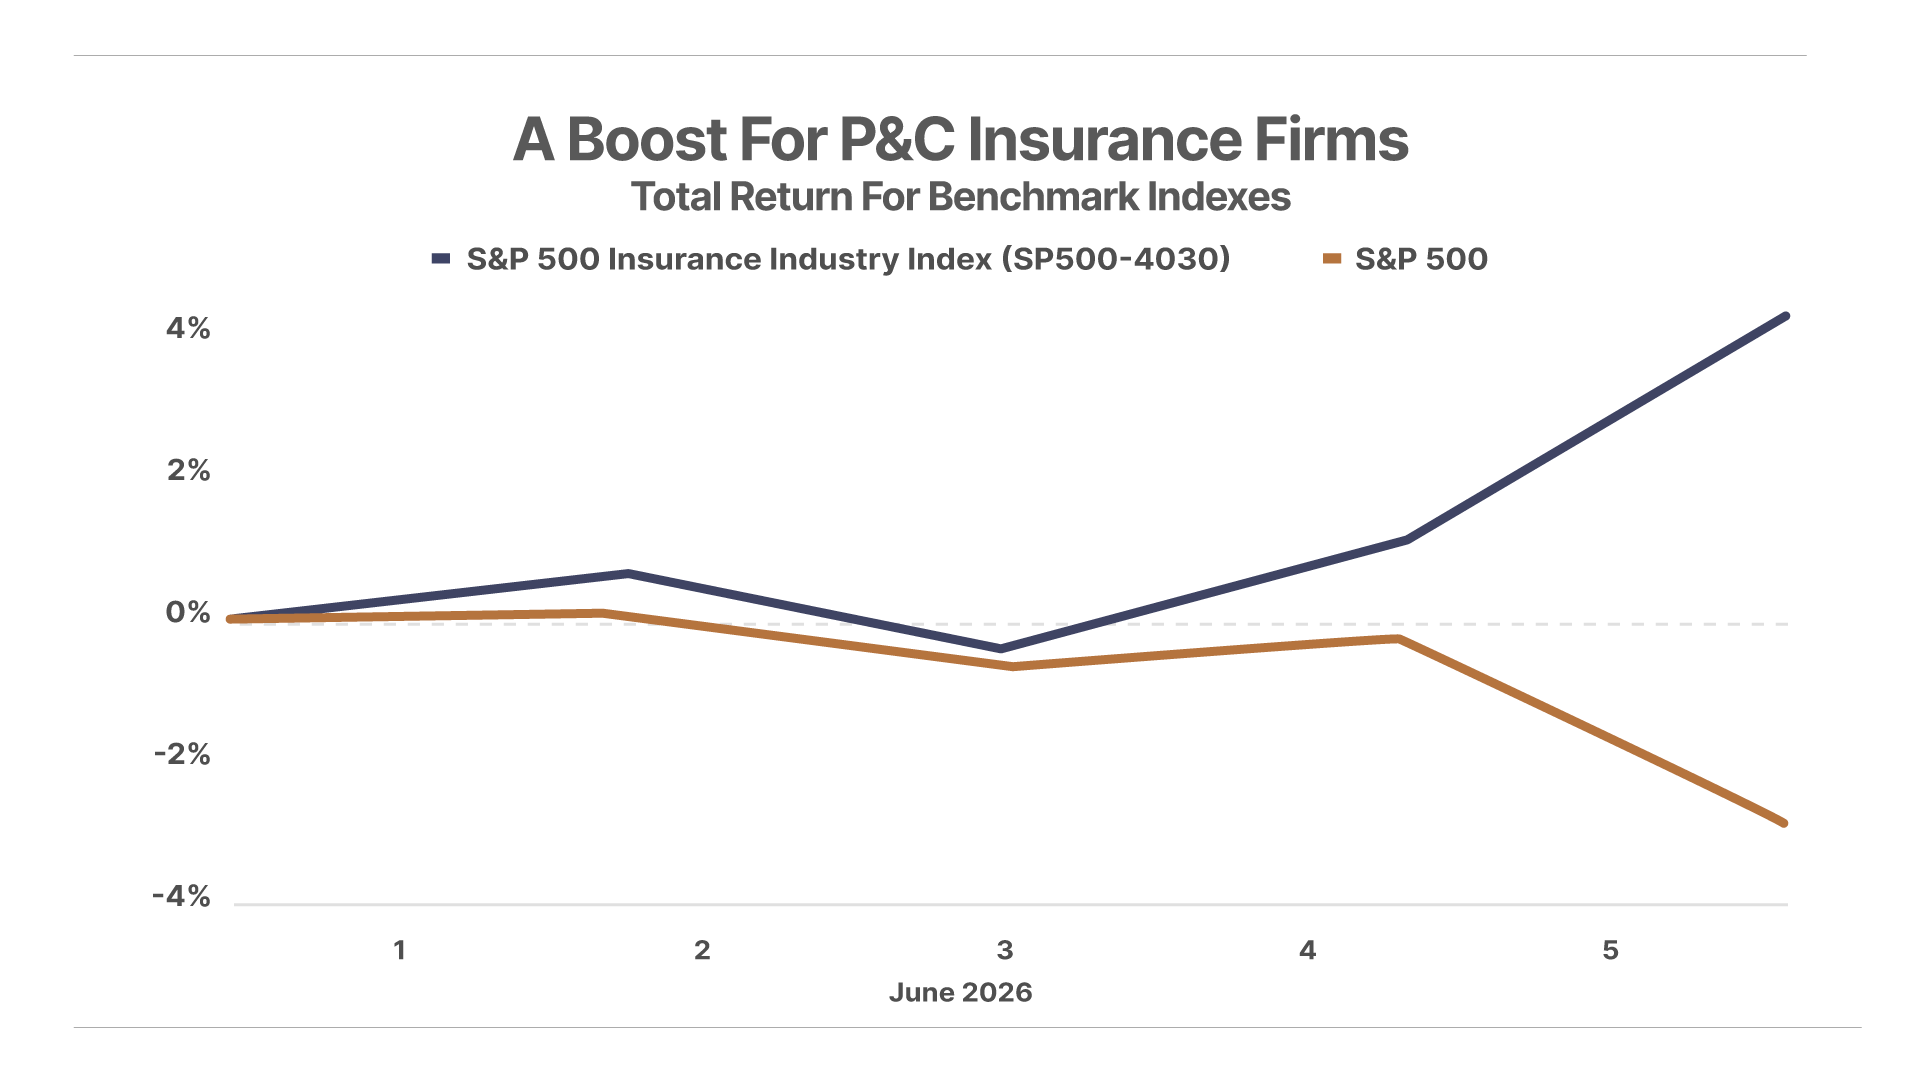
The S&P 500 Insurance Industry Group Index (SP500-4030) was up 4.3% last week, with standout performers like Complete Investor recommendation W. R. Berkley (WRB) jumping 7.92%. Higher-for-longer rates benefit insurers, which earn more on the float they hold in investment portfolios.
Poll Results… SpaceX
Shares of Elon Musk’s rocket company SpaceX (SPCX) will IPO later this month – as early as next week. On Friday, we asked Daily Journal readers the following: “Where will SPCX shares trade on December 31 of this year?”
And 78% of survey takers selected “lower than the day-one closing price” versus 22% who think SpaceX shares will trade higher on December 31 than they will at the end of their first day of trading.
Mailbag
“Permanent Portfolio Versus Index ETF PCPP”
Russ R. writes:
Porter,
I have been a partner since June 2025 and immensely enjoy and value your work. I am 55 years old and have been a small-business owner for 26 years (Hunting Outfitter), prior to that I was a guide since I was 18. I started saving and investing way too late in life, approximately the last 10 years. I have been doing everything I can to make up for that, investing as much as possible. I have really tried to use your advice as best I can for someone who does not have a background in the stock market and investing long term by investing in quality businesses, and feel I have done well. That being said, I have approximately $850,000 invested currently and watch that total sway $40,000 to $50,000 on any given day the last several months, depending on the market. I am really looking at putting around $500,000 in Porter’s Permanent Portfolio or the Index ETF (PCPP) that I just recently read about.
Could you please tell me if there are any pros or cons between the two of them and any differences? I am fully aware that you cannot give financial advice. I simply want to know if they are one and the same with me watching and keeping up on everything myself with Porter’s Permanent Portfolio, or if I choose the Index ETF that is managed by Tuttle Capital.
One last thing, I just finished reading 2029: The End of America. What a fabulous book written with extreme honesty rather than the politically correct bullshit (with politically correct being a complete misnomer because nothing is correct about it) that has brought us to where we are. You seriously would have to be mentally retarded not to see and feel all the things you explained in your book, but the thing that was nice for me was to be able to fully understand the what, where, why, and whom that brought all of it about. Thank you!
“PCPP ETF”
Chris H. writes:
Thank you! I love the automatic adjustment feature in the Porter Portfolio Index ETF (PCPP).
I’d love it if Porter and author Robert Kiyosaki would join forces and create a Patriot Income ETF that also automatically adjusts. Also an ETF that simplifies the future of technology associated with the chip industry, robotics, future communication, and manufacturing.
The automatic correction feature the Porter Portfolio Index (PCPP) has is another winner for me… I would invest in all three ETFs without any hesitation and sleep soundly every night… I would also create accounts for my son and grandchildren for the future.
I feel PCPP is the start – the other two are a wish list! You guys are great! You’re truly thinking of your investors/members’ best interest, for their families and the future!
“Honeycomb”
Mike B. writes:
I would very much like to run the Honeycomb Portfolio. However, I do have a question.
Will Best-In-Class names be shared each year on the rebalance date? The correlation piece is too complicated for most to run and is obviously very important.
Porter & Co. Market Snapshot
| Price | Friday’s Return | Year-to-Date Return | |
|---|---|---|---|
| S&P 500 Index | $7,383.74 | -2.64% | 8.4% |
| Gold per ounce | $4,328.10 | -3.27% | 0.2% |
| Bitcoin | $61,852 | 1.91% | -27.6% |
| Oil (West Texas Intermediate) per barrel | $90.54 | -2.46% | 59.9% |
| Berkshire Hathaway (BRK) | $733,550.00 | 2.11% | -2.8% |
| Porter’s Permanent Portfolio | – | -0.21% | -2.9% |
| The Better Than Berkshire Index | – | -0.86% | 2.9% |
| Total Return | Annual Return | ||
| Porter & Co’s Top Ranked* | 31.4% | 13.7% | |
| Yield | Friday’s Change | Change Year-to-Date |
|
| U.S Treasury 30-Year Yield | 5.00% | 2 bps | 15 bps |
*A Complete Investor risk rating of 1 is defined as a “low risk, high allocation” security, while positions rated closer to a 5 are higher risk. Porter & Co.’s top-ranked positions include those rated either 1 or 2 in Complete Investor portfolio.
Porter & Co. Top Positions
| Publication | Ticker | Description | Total Return |
|---|---|---|---|
| Tech Frontiers | QURE | uniQure | 237% |
| Complete Investor | BWXT | BWX Technologies | 226% |
| Complete Investor | ARM | ARM Holdings | 148% |
| Complete Investor | BTC/USD | Bitcoin | 134% |
| Tech Frontiers | QURE | uniQure | 131% |
| Tech Frontiers | ROIV | Roivant Sciences | 127% |
| Tech Frontiers | SGMT | Sagimet Biosciences | 125% |
| Complete Investor | PM | Philip Morris | 121% |
| Tech Frontiers | TGTX | TG Therapeutics | 115% |
| Distressed Investing | PTON | Peloton Interactive | 105% |
Prices as of 4:00 pm ET June 5, 2026
Please note: The investments in our “Porter & Co. Top Positions” should not be considered current recommendations. These positions are the best performers across our publications – and the securities listed may (or may not) be above the current buy-up-to price. To learn more, visit the current recommendations page of the relevant service, here. To gain access or to learn more about our current recommendations, call our Customer Care team at 888-610-8895 or internationally at +1 443-815-4447.